Basal metabolic rate
Basal metabolic rate (BMR) is the minimal rate of energy expenditure per unit time by endothermic animals at rest.[1] It is reported in energy units per unit time ranging from watt (joule/second) to ml O2/min or joule per hour per kg body mass J/(h·kg)). Proper measurement requires a strict set of criteria be met. These criteria include being in a physically and psychologically undisturbed state, in a thermally neutral environment, while in the post-absorptive state (i.e., not actively digesting food).[1] In bradymetabolic animals, such as fish and reptiles, the equivalent term standard metabolic rate (SMR) is used. It follows the same criteria as BMR, but requires the documentation of the temperature at which the metabolic rate was measured. This makes BMR a variant of standard metabolic rate measurement that excludes the temperature data, a practice that has led to problems in defining "standard" rates of metabolism for many mammals.[1]
Metabolism refers to the processes that the body needs to function. Basal metabolic rate is the amount of energy expressed in calories that a person needs to keep the body functioning at rest. Some of those processes are breathing, blood circulation, controlling body temperature, cell growth, brain and nerve function, and contraction of muscles. Basal metabolic rate (BMR) affects the rate that a person burns calories and ultimately whether that individual maintains, gains, or loses weight. The basal metabolic rate accounts for about 60 to 75% of the daily calorie expenditure by individuals. It is influenced by several factors. BMR typically declines by 1–2% per decade after age 20, mostly due to loss of fat-free mass,[2] although the variability between individuals is high.[3]
Description
The body's generation of heat is known as thermogenesis and it can be measured to determine the amount of energy expended. BMR generally decreases with age and with the decrease in lean body mass (as may happen with aging). Increasing muscle mass has the effect of increasing BMR. Aerobic (resistance) fitness level, a product of cardiovascular exercise, while previously thought to have effect on BMR, has been shown in the 1990s not to correlate with BMR when adjusted for fat-free body mass. But anaerobic exercise does increase resting energy consumption (see "aerobic vs. anaerobic exercise").[4] Illness, previously consumed food and beverages, environmental temperature, and stress levels can affect one's overall energy expenditure as well as one's BMR.

BMR is measured under very restrictive circumstances when a person is awake. An accurate BMR measurement requires that the person's sympathetic nervous system not be stimulated, a condition which requires complete rest. A more common measurement, which uses less strict criteria, is resting metabolic rate (RMR).[5]
BMR may be measured by gas analysis through either direct or indirect calorimetry, though a rough estimation can be acquired through an equation using age, sex, height, and weight. Studies of energy metabolism using both methods provide convincing evidence for the validity of the respiratory quotient (R.Q.), which measures the inherent composition and utilization of carbohydrates, fats and proteins as they are converted to energy substrate units that can be used by the body as energy.
Nutrition and dietary considerations
Basal metabolism is usually by far the largest component of total caloric expenditure. However, the Harris–Benedict equations are only approximate and variation in BMR (reflecting varying body composition), in physical activity levels, and in energy expended in thermogenesis make it difficult to estimate the dietary consumption any particular individual needs in order to maintain body weight.
Physiology
The early work of the scientists J. Arthur Harris and Francis G. Benedict showed that approximate values for BMR could be derived using body surface area (computed from height and weight), age, and sex, along with the oxygen and carbon dioxide measures taken from calorimetry. Studies also showed that by eliminating the sex differences that occur with the accumulation of adipose tissue by expressing metabolic rate per unit of "fat-free" or lean body mass, the values between sexes for basal metabolism are essentially the same. Exercise physiology textbooks have tables to show the conversion of height and body surface area as they relate to weight and basal metabolic values.
The primary organ responsible for regulating metabolism is the hypothalamus. The hypothalamus is located on the diencephalon and forms the floor and part of the lateral walls of the third ventricle of the cerebrum. The chief functions of the hypothalamus are:
- control and integration of activities of the autonomic nervous system (ANS)
- The ANS regulates contraction of smooth muscle and cardiac muscle, along with secretions of many endocrine organs such as the thyroid gland (associated with many metabolic disorders).
- Through the ANS, the hypothalamus is the main regulator of visceral activities, such as heart rate, movement of food through the gastrointestinal tract, and contraction of the urinary bladder.
- production and regulation of feelings of rage and aggression
- regulation of body temperature
- regulation of food intake, through two centers:
- The feeding center or hunger center is responsible for the sensations that cause us to seek food. When sufficient food or substrates have been received and leptin is high, then the satiety center is stimulated and sends impulses that inhibit the feeding center. When insufficient food is present in the stomach and ghrelin levels are high, receptors in the hypothalamus initiate the sense of hunger.
- The thirst center operates similarly when certain cells in the hypothalamus are stimulated by the rising osmotic pressure of the extracellular fluid. If thirst is satisfied, osmotic pressure decreases.
- control and integration of activities of the autonomic nervous system (ANS)
All of these functions taken together form a survival mechanism that causes us to sustain the body processes that BMR measures.
BMR estimation formulas
Several prediction equations exist. Historically, the most notable one was the Harris-Benedict equation, which was created in 1919.
In each of the formulas:
- P is total heat production at complete rest,
- m is mass (kg),
- h is height (cm), and
- a is age (years),[6]
The Original Harris-Benedict Equation:
- for men,
- for women, [6]


The difference in BMR for men and women is mainly due to differences in body weight.
In 1984, the original Harris-Benedict equations were revised[7] using new data. In comparisons with actual expenditure, the revised equations were found to be more accurate.[8]
The Revised Harris-Benedict Equation:
- for men,
- for women,


It was the best prediction equation until 1990, when Mifflin et al.[9] introduced the equation:
The Mifflin St Jeor Equation:
- , where s is +5 for males and −161 for females.

According to this formula, the woman in the example above has a BMR of 1204 kcal per day. During the last 100 years, lifestyles have changed and Frankenfield et al.[10][11] showed it to be about 5% more accurate.
These formulas are based on body weight, which does not take into account the difference in metabolic activity between lean body mass and body fat. Other formulas exist which take into account lean body mass, two of which are the Katch-McArdle formula, and Cunningham formula. The Katch-McArdle formula is used to predict Resting Daily Energy Expenditure (RDEE).[12] The Cunningham formula is commonly attributed as being used to predict RMR instead of BMR, however the formulas provided by Katch-McArdle and Cunningham are the same.[13]
The Katch-McArdle Formula (Resting Daily Energy Expenditure):
- , where LBM is the lean body mass in kg.

According to this formula, if the woman in the example has a body fat percentage of 30%, her RDEE (the authors use the term of basal and resting metabolism interchangeably) would be 1263 kcal per day.
Causes of individual differences in BMR
The basal metabolic rate varies between individuals. One study of 150 adults representative of the population in Scotland reported basal metabolic rates from as low as 1027 kcal per day (4301 kJ/day) to as high as 2499 kcal/day (10455 kJ/day); with a mean BMR of 1500 kcal/day (6279 kJ/day). Statistically, the researchers calculated that 62.3% of this variation was explained by differences in fat free mass. Other factors explaining the variation included fat mass (6.7%), age (1.7%), and experimental error including within-subject difference (2%). The rest of the variation (26.7%) was unexplained. This remaining difference was not explained by sex nor by differing tissue size of highly energetic organs such as the brain.[14]
Differences in BMR have been observed when comparing subjects with the same lean body mass. In one study, when comparing individuals with the same lean body mass, the top 5% of BMRs are 28-32% higher than the lowest 5% BMR.[15] Additionally, this study reports a case where two individuals with the same lean body mass of 43 kg had BMRs of 1075 kcal/day (4.5 MJ/day) and 1790 kcal/day (7.5 MJ/day). This difference of 715 kcal/day (67%) is equivalent to one of the individuals completing a 10 kilometer run every day.[15] However, this study did not account for the sex, height, fasting-state, or body fat percentage of the subjects.
Biochemistry
| Energy expenditure breakdown[16] | |
|---|---|
| Liver | 27% |
| Brain | 19% |
| Skeletal Muscle | 18% |
| Kidneys | 10% |
| Heart | 7% |
| Other organs | 19% |
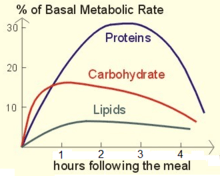
About 70% of a human's total energy expenditure is due to the basal life processes within the organs of the body (see table). About 20% of one's energy expenditure comes from physical activity and another 10% from thermogenesis, or digestion of food (postprandial thermogenesis).[17] All of these processes require an intake of oxygen along with coenzymes to provide energy for survival (usually from macronutrients like carbohydrates, fats, and proteins) and expel carbon dioxide, due to processing by the Krebs cycle.
For the BMR, most of the energy is consumed in maintaining fluid levels in tissues through osmoregulation, and only about one-tenth is consumed for mechanical work, such as digestion, heartbeat, and breathing.[18]
What enables the Krebs cycle to perform metabolic changes to fats, carbohydrates, and proteins is energy, which can be defined as the ability or capacity to do work. The breakdown of large molecules into smaller molecules—associated with release of energy—is catabolism. The building up process is termed anabolism. The breakdown of proteins into amino acids is an example of catabolism, while the formation of proteins from amino acids is an anabolic process.
Exergonic reactions are energy-releasing reactions and are generally catabolic. Endergonic reactions require energy and include anabolic reactions and the contraction of muscle. Metabolism is the total of all catabolic, exergonic, anabolic, endergonic reactions.
Adenosine Triphosphate (ATP) is the intermediate molecule that drives the exergonic transfer of energy to switch to endergonic anabolic reactions used in muscle contraction. This is what causes muscles to work which can require a breakdown, and also to build in the rest period, which occurs during the strengthening phase associated with muscular contraction. ATP is composed of adenine, a nitrogen containing base, ribose, a five carbon sugar (collectively called adenosine), and three phosphate groups. ATP is a high energy molecule because it stores large amounts of energy in the chemical bonds of the two terminal phosphate groups. The breaking of these chemical bonds in the Krebs Cycle provides the energy needed for muscular contraction.
Glucose
Because the ratio of hydrogen to oxygen atoms in all carbohydrates is always the same as that in water—that is, 2 to 1—all of the oxygen consumed by the cells is used to oxidize the carbon in the carbohydrate molecule to form carbon dioxide. Consequently, during the complete oxidation of a glucose molecule, six molecules of carbon dioxide and six molecules of water are produced and six molecules of oxygen are consumed.
The overall equation for this reaction is:
- C6H12O6 + 6 O2 → 6 CO2 + 6 H2O
(38 ATP molecules)
Because the gas exchange in this reaction is equal, the respiratory quotient (R.Q.) for carbohydrate is unity or 1.0:
- R.Q. = 6 CO2 / 6 O2 = 1.0
Fats
The chemical composition for fats differs from that of carbohydrates in that fats contain considerably fewer oxygen atoms in proportion to atoms of carbon and hydrogen. When listed on nutritional information tables, fats are generally divided into six categories: total fats, saturated fatty acid, polyunsaturated fatty acid, monounsaturated fatty acid, dietary cholesterol, and trans fatty acid. From a basal metabolic or resting metabolic perspective, more energy is needed to burn a saturated fatty acid than an unsaturated fatty acid. The fatty acid molecule is broken down and categorized based on the number of carbon atoms in its molecular structure. The chemical equation for metabolism of the twelve to sixteen carbon atoms in a saturated fatty acid molecule shows the difference between metabolism of carbohydrates and fatty acids. Palmitic acid is a commonly studied example of the saturated fatty acid molecule.
The overall equation for the substrate utilization of palmitic acid is:
- C16H32O2 + 23 O2 → 16 CO2 + 16 H2O
Thus the R.Q. for palmitic acid is 0.696:
- R.Q. = 16 CO2 / 23 O2 = 0.696
Proteins
Proteins are composed of carbon, hydrogen, oxygen, and nitrogen arranged in a variety of ways to form a large combination of amino acids. Unlike fat the body has no storage deposits of protein. All of it is contained in the body as important parts of tissues, blood hormones, and enzymes. The structural components of the body that contain these amino acids are continually undergoing a process of breakdown and replacement. The respiratory quotient for protein metabolism can be demonstrated by the chemical equation for oxidation of albumin:
- C72H112N18O22S + 77 O2 → 63 CO2 + 38 H2O + SO3 + 9 CO(NH2)2
The R.Q. for albumin is 63 CO2/ 77 O2 = 0.818
The reason this is important in the process of understanding protein metabolism is that the body can blend the three macronutrients and based on the mitochondrial density, a preferred ratio can be established which determines how much fuel is utilized in which packets for work accomplished by the muscles. Protein catabolism (breakdown) has been estimated to supply 10% to 15% of the total energy requirement during a two-hour aerobic training session. This process could severely degrade the protein structures needed to maintain survival such as contractile properties of proteins in the heart, cellular mitochondria, myoglobin storage, and metabolic enzymes within muscles.
The oxidative system (aerobic) is the primary source of ATP supplied to the body at rest and during low intensity activities and uses primarily carbohydrates and fats as substrates. Protein is not normally metabolized significantly, except during long term starvation and long bouts of exercise (greater than 90 minutes.) At rest approximately 70% of the ATP produced is derived from fats and 30% from carbohydrates. Following the onset of activity, as the intensity of the exercise increases, there is a shift in substrate preference from fats to carbohydrates. During high intensity aerobic exercise, almost 100% of the energy is derived from carbohydrates, if an adequate supply is available.
Aerobic vs. anaerobic exercise
Studies published in 1992[19] and 1997[20] indicate that the level of aerobic fitness of an individual does not have any correlation with the level of resting metabolism. Both studies find that aerobic fitness levels do not improve the predictive power of fat free mass for resting metabolic rate.
Anaerobic exercise, such as weight lifting, builds additional muscle mass. Muscle contributes to the fat-free mass of an individual and therefore effective results from anaerobic exercise will increase BMR.[21] However, the actual effect on BMR is controversial and difficult to enumerate. Various studies[22][23] suggest that the resting metabolic rate of trained muscle is around 55kJ per kilogram, per day. Even a substantial increase in muscle mass, say 5 kg, would make only a minor impact on BMR.
Longevity
In 1926, Raymond Pearl proposed that longevity varies inversely with basal metabolic rate (the "rate of living hypothesis"). Support for this hypothesis comes from the fact that mammals with larger body size have longer maximum life spans (large animals do have higher total metabolic rates, but the metabolic rate at the cellular level is much lower, and the breathing rate and heartbeat are slower in larger animals) and the fact that the longevity of fruit flies varies inversely with ambient temperature.[24] Additionally, the life span of houseflies can be extended by preventing physical activity.[25] This theory has been bolstered by several new studies linking lower basal metabolic rate to increased life expectancy, across the animal kingdom—including humans. Calorie restriction and reduced thyroid hormone levels, both of which decrease the metabolic rate, have been associated with higher longevity in animals.[26][27][28][29]
However, the ratio of total daily energy expenditure to resting metabolic rate can vary between 1.6 and 8.0 between species of mammals. Animals also vary in the degree of coupling between oxidative phosphorylation and ATP production, the amount of saturated fat in mitochondrial membranes, the amount of DNA repair, and many other factors that affect maximum life span.[30]
Organism longevity and basal metabolic rate
In allometric scaling, maximum potential life span (MPLS) is directly related to metabolic rate (MR), where MR is the recharge rate of a biomass made up of covalent bonds. That biomass (W) is subjected to deterioration over time from thermodynamic, entropic pressure. Metabolism is essentially understood as redox coupling, and has nothing to do with thermogenesis. Metabolic efficiency (ME) is then expressed as the efficiency of this coupling, a ratio of amperes captured and used by biomass, to the amperes available for that purpose. MR is measured in watts, W is measured in grams. These factors are combined in a power law, an elaboration on Kleiber's law relating MR to W and MPLS, that appears as MR = W^ (4ME-1)/4ME. When ME is 100%, MR = W^3/4; this is popularly known as quarter power scaling, a version of allometric scaling that is premised upon unrealistic estimates of biological efficiency.
The equation reveals that as ME drops below 20%, for W < one gram, MR/MPLS increases so dramatically as to endow W with virtual immortality by 16%. The smaller W is to begin with, the more dramatic is the increase in MR as ME diminishes. All of the cells of an organism fit into this range, i.e., less than one gram, and so this MR will be referred to as BMR.
But the equation reveals that as ME increases over 25%, BMR approaches zero. The equation also shows that for all W > one gram, where W is the organization of all of the BMRs of the organism's structure, but also includes the activity of the structure, as ME increases over 25%, MR/MPLS increases rather than decreases, as it does for BMR. An MR made up of an organization of BMRs will be referred to as an FMR. As ME decreases below 25%, FMR diminishes rather than increases as it does for BMR.
The antagonism between FMR and BMR is what marks the process of aging of biomass W in energetic terms. The ME for the organism is the same as that for the cells, such that the success of the organism's ability to find food (and lower its ME), is key to maintaining the BMR of the cells driven, otherwise, by starvation, to approaching zero; while at the same time a lower ME diminishes the FMR/MPLS of the organism.
Medical considerations
A person's metabolism varies with their physical condition and activity. Weight training can have a longer impact on metabolism than aerobic training, but there are no known mathematical formulas that can exactly predict the length and duration of a raised metabolism from trophic changes with anabolic neuromuscular training.
A decrease in food intake will typically lower the metabolic rate as the body tries to conserve energy.[31] Researcher Gary Foster, Ph.D., estimates that a very low calorie diet of fewer than 800 calories a day would reduce the metabolic rate by more than 10 percent.[32]
The metabolic rate can be affected by some drugs, such as antithyroid agents, drugs used to treat hyperthyroidism, such as propylthiouracil and methimazole, bring the metabolic rate down to normal and restore euthyroidism. Some research has focused on developing antiobesity drugs to raise the metabolic rate, such as drugs to stimulate thermogenesis in skeletal muscle.
The metabolic rate may be elevated in stress, illness, and diabetes. Menopause may also affect metabolism.
Cardiovascular implications
Heart rate is determined by the medulla oblongata and part of the pons, two organs located inferior to the hypothalamus on the brain stem. Heart rate is important for basal metabolic rate and resting metabolic rate because it drives the blood supply, stimulating the Krebs cycle. During exercise that achieves the anaerobic threshold, it is possible to deliver substrates that are desired for optimal energy utilization. The anaerobic threshold is defined as the energy utilization level of heart rate exertion that occurs without oxygen during a standardized test with a specific protocol for accuracy of measurement, such as the Bruce Treadmill protocol (see metabolic equivalent). With four to six weeks of targeted training the body systems can adapt to a higher perfusion of mitochondrial density for increased oxygen availability for the Krebs cycle, or tricarboxylic cycle, or the glycolitic cycle. This in turn leads to a lower resting heart rate, lower blood pressure, and increased resting or basal metabolic rate.
By measuring heart rate we can then derive estimations of what level of substrate utilization is actually causing biochemical metabolism in our bodies at rest or in activity. This in turn can help a person to maintain an appropriate level of consumption and utilization by studying a graphical representation of the anaerobic threshold. This can be confirmed by blood tests and gas analysis using either direct or indirect calorimetry to show the effect of substrate utilization. The measures of basal metabolic rate and resting metabolic rate are becoming essential tools for maintaining a healthy body weight.
See also
- Food energy
- Harris-Benedict equation
- Hyperthyroidism
- Hypothyroidism
- Kleiber's law
- Metabolic age
- Metabolic syndrome
- Schofield equation
- Thermic effect of food
References
- 1 2 3 (McNab, B. K. 1997). On the Utility of Uniformity in the Definition of Basal Rate of Metabolism. Physiol. Zool. Vol.70; 718–720.
- ↑ Manini TM (2010). "Energy expenditure and aging". Ageing Research Reviews. 9 (1): 1–11. doi:10.1016/j.arr.2009.08.002. PMC 2818133
 . PMID 19698803.
 - ↑ McMurray RG, Soares J, Caspersen CJ, McCurdy T (2014). "Examining variations of resting metabolic rate of adults: a public health perspective". Medicine & Science in Sports & Exercise. 46 (7): 1352–1358. doi:10.1249/MSS.0000000000000232. PMC 4535334. PMID 24300125.
- ↑ Stiegler P, Cunliffe A (2006). "The role of diet and exercise for the maintenance of fat-free mass and resting metabolic rate during weight loss" (PDF). SPORTS MEDICINE. 36 (3): 239–262. doi:10.2165/00007256-200636030-00005. PMID 16526835.
- ↑ CaloriesPerHour.com. "Diet and Weight Loss Tutorial". Calculating BMR and RMR. Archived from the original on 5 January 2008. Retrieved 2008-01-26.
- 1 2 Harris J, Benedict F (1918). "A Biometric Study of Human Basal Metabolism". PNAS. 4 (12): 370–3. Bibcode:1918PNAS....4..370H. doi:10.1073/pnas.4.12.370. PMC 1091498. PMID 16576330.
- ↑ Roza, Allan M; Shizgal, Harry M (1984). "The Harris Benedict equation reevaluated: resting energy requirements and the body cell mass". The American Journal of Clinical Nutrition. 40: 168–182.
- ↑ Müller, B; Merk, S; Bürgi, U; Diem, P (2001). "Calculating the basal metabolic rate and severe and morbid obesity". Praxis (Bern 1994). 90 (45): 1955–63.
- ↑ Mifflin, MD; St Jeor, ST; Hill, LA; Scott, BJ; Daugherty, SA; Koh, YO (1990). "A new predictive equation for resting energy expenditure in healthy individuals". The American Journal of Clinical Nutrition. 51 (2): 241–7. PMID 2305711.
- ↑ Frankenfield, David; Roth-Yousey, Lori; Compher, Charlene (2005). "Comparison of Predictive Equations for Resting Metabolic Rate in Healthy Nonobese and Obese Adults: A Systematic Review". Journal of the American Dietetic Association. 105 (5): 775–89. doi:10.1016/j.jada.2005.02.005. PMID 15883556.
- ↑ Frankenfield D, Roth-Yousey L, Compher C (May 2005). "Comparison of predictive equations for resting metabolic rate in healthy nonobese and obese adults: a systematic review". J Am Diet Assoc. 105: 775–89. doi:10.1016/j.jada.2005.02.005. PMID 15883556.
- ↑ McArdle, W (2006). Essentials of Exercise Physiology. Lippincott Williams & Wilkins. p. 266. ISBN 9780495014836.
- ↑ Dunford, M (2007). Nutrition for Sport and Exercise. Brooks/Cole. p. 57. ISBN 9780781749916.
- ↑ Johnstone, Alexandra M; Murison, Sandra D; Duncan, Jackie S; Rance, Kellie A; Speakman, John R; Koh, YO (2005). "Factors influencing variation in basal metabolic rate include fat-free mass, fat mass, age, and circulating thyroxine but not sex, circulating leptin, or triiodothyronine". American Journal of Clinical Nutrition. 82 (5): 941–948. PMID 16280423.
- 1 2 Speakman, John R.; Król, Elzbieta; Johnson, Maria S. (2004). "The Functional Significance of Individual Variation in Basal Metabolic Rate". Physiological and Biochemical Zoology. 77 (6): 900–915. doi:10.1086/427059. PMID 15674765.
- ↑ Durnin, JVGA (1981). "Basal metabolic rate in man". Report to FAO/ WHO/UNU. Rome: FAO.
- ↑ McArdle, William D. (1986). Exercise Physiology (2nd ed.). Philadelphia: Lea & Febigier.
- ↑ Lisa Gordon-Davis (2004). Hospitality Industry Handbook on Nutrition and Menu Planning. Juta and Company Ltd. p. 112. ISBN 978-0-7021-5578-9.
- ↑ Broeder, CE; Burrhus, KA; Svanevik, LS; Wilmore, JH (1992). "The effects of aerobic fitness on resting metabolic rate". The American Journal of Clinical Nutrition. 55 (4): 795–801. PMID 1550061.
- ↑ Smith, DA; Dollman, J; Withers, RT; Brinkman, M; Keeves, JP; Clark, DG (1997). "Relationship between maximum aerobic power and resting metabolic rate in young adult women". Journal of applied physiology. 82 (1): 156–63. PMID 9029211.
- ↑ Ravussin, E; Lillioja, S; Christin, L; Bogardus, C; Bogardus, C (1986). "Determinants of 24-hour energy expenditure in man. Methods and results using a respiratory chamber". The Journal of Clinical Invertigation. 78 (6): 1568–1578. doi:10.1172/JCI112749.
- ↑ Campbell, W; Crim, M; Young, V; Evans, W (1994). "Increased energy requirements and changes in body composition with resistance training in older adults". American Journal of Clinical Nutrition. 60 (2): 167–175. PMID 8030593.
- ↑ Pratley, R; Nicklas, B; Rubin, M; Miller, J; Smith, A; Smith, M; Hurley, B; Goldberg, A (1994). "Strength training increases resting metabolic rate and norepinephrine levels in healthy 50- to 65-year-old men". Journal of Applied Physiology. 76 (1): 133–137. PMID 8175496.
- ↑ Miquel, Jaime; Lundgren, Paul R.; Bensch, Klaus G.; Atlan, Henri (1976). "Effects of temperature on the life span, vitality and fine structure of Drosophila melanogaster". Mechanisms of Ageing and Development. 5 (5): 347–70. doi:10.1016/0047-6374(76)90034-8. PMID 823384.
- ↑ Ragland, S.S.; Sohal, R.S. (1975). "Ambient temperature, physical activity and aging in the housefly, Musca domestica". Experimental Gerontology. 10 (5): 279–89. doi:10.1016/0531-5565(75)90005-4. PMID 1204688.
- ↑ Hulbert AJ, Pamplona R, Buffenstein R, Buttemer WA (October 2007). "Life and death: metabolic rate, membrane composition, and life span of animals". Physiol. Rev. 87 (4): 1175–213. doi:10.1152/physrev.00047.2006. PMID 17928583.
- ↑ Olshansky, SJ; Rattan, SI (2005). "What determines longevity: Metabolic rate or stability?". Discovery medicine. 5 (28): 359–62. PMID 20704872.
- ↑ Aguilaniu, H. (2005). "Metabolism, ubiquinone synthesis, and longevity". Genes & Development. 19 (20): 2399–406. doi:10.1101/gad.1366505.
- ↑ Atzmon, G.; Barzilai, N.; Surks, M. I.; Gabriely, I. (2009). "Genetic Predisposition to Elevated Serum Thyrotropin is Associated with Exceptional Longevity". Journal of Clinical Endocrinology & Metabolism. 94 (12): 4768–75. doi:10.1210/jc.2009-0808. PMC 2795660. PMID 19837933. Lay summary – Reuters (June 13, 2009).
- ↑ Speakman, JR; Selman, C; McLaren, JS; Harper, EJ (2002). "Living fast, dying when? The link between aging and energetics". The Journal of Nutrition. 132 (6 Suppl 2): 1583S–97S. PMID 12042467.
- ↑ Grattan BJ Jr; Connolly-Schoonen J (2012). "Addressing weight loss recidivism: a clinical focus on metabolic rate and the psychological aspects of obesity". ISRN OBESITY. 2012: 567530. doi:10.5402/2012/567530. PMC 3914266. PMID 24527265.
- ↑ Whitman, Stacy "The Truth about Metabolism." Shape. September 2003.
Further reading
- Tsai, AG; Wadden, TA (2005). "Systematic review: An evaluation of major commercial weight loss programs in the United States". Annals of Internal Medicine. 142 (1): 56–66. doi:10.7326/0003-4819-142-1-200501040-00012. PMID 15630109.
- Gustafson, D.; Rothenberg, E; Blennow, K; Steen, B; Skoog, I (2003). "An 18-Year Follow-up of Overweight and Risk of Alzheimer Disease". Archives of Internal Medicine. 163 (13): 1524–8. doi:10.1001/archinte.163.13.1524. PMID 12860573.
- "Clinical guidelines on the identification, evaluation, and treatment of overweight and obesity in adults: Executive summary. Expert Panel on the Identification, Evaluation, and Treatment of Overweight in Adults". The American Journal of Clinical Nutrition. 68 (4): 899–917. 1998. PMID 9771869.
- Segal, Arthur C. (1987). "Linear Diet Model". College Mathematics Journal. 18 (1): 44–5. doi:10.2307/2686315.
- Pike, Ruth L; Brown, Myrtle Laurestine (1975). Nutrition: An Integrated Approach (2nd ed.). New York: Wiley. OCLC 474842663.
- Sahlin, K.; Tonkonogi, M.; Soderlund, K. (1998). "Energy supply and muscle fatigue in humans". Acta Physiologica Scandinavica. 162 (3): 261–6. doi:10.1046/j.1365-201X.1998.0298f.x. PMID 9578371.
- Saltin, Bengt; Gollnick, Philip D. (1983). "Skeletal muscle adaptability: Significance for metabolism and performance". In Peachey, Lee D; Adrian, Richard H; Geiger, Stephen R. Handbook of Physiology. Baltimore: Williams & Wilkins. pp. 540–55. OCLC 314567389. Republished as: Saltin, Bengt; Gollnick, Philip D. (2011). "Skeletal Muscle Adaptability: Significance for Metabolism and Performance". Comprehensive Physiology. doi:10.1002/cphy.cp100119. ISBN 978-0-470-65071-4.
- Thorstensson (1976). "Muscle strength, fibre types and enzyme activities in man". Acta physiologica Scandinavica. Supplementum. 443: 1–45. PMID 189574.
- Thorstensson, Alf; Sjödin, Bertil; Tesch, Per; Karlsson, Jan (1977). "Actomyosin ATPase, Myokinase, CPK and LDH in Human Fast and Slow Twitch Muscle Fibres". Acta Physiologica Scandinavica. 99 (2): 225–9. doi:10.1111/j.1748-1716.1977.tb10373.x. PMID 190869.
- Vanhelder, W. P.; Radomski, M. W.; Goode, R. C.; Casey, K. (1985). "Hormonal and metabolic response to three types of exercise of equal duration and external work output". European Journal of Applied Physiology and Occupational Physiology. 54 (4): 337–42. doi:10.1007/BF02337175. PMID 3905393.
- Wells, JG; Balke, B; Van Fossan, DD (1957). "Lactic acid accumulation during work; a suggested standardization of work classification". Journal of applied physiology. 10 (1): 51–5. PMID 13405829.
- McArdle, William D; Katch, Frank I; Katch, Victor L (1986). Exercise Physiology: Energy, Nutrition, and Human Performance. Philadelphia: Lea & Febiger. OCLC 646595478.
- Harris, JA; Benedict, FG (1918). "A Biometric Study of Human Basal Metabolism". Proceedings of the National Academy of Sciences of the United States of America. 4 (12): 370–3. Bibcode:1918PNAS....4..370H. doi:10.1073/pnas.4.12.370. PMC 1091498. PMID 16576330.
External links
- Harris-Benedict study. Detailed discussion of antecedents, data, measurements, statistics (Published by The Carnegie Institution of Washington 1919)
- BMR as affected by alcohol
- BMR and personality