Break-even (economics)
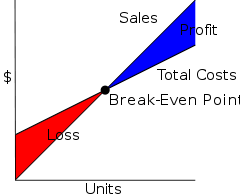
The break-even point (BEP) in economics, business, and specifically cost accounting, is the point at which total cost and total revenue are equal: there is no net loss or gain, and one has "broken even." A profit or a loss has not been made, although opportunity costs have been "paid", and capital has received the risk-adjusted, expected return. In short, all costs that needs to be paid are paid by the firm but the profit is equal to 0.[1][2]
Overview
The break-even point (BEP) or break-even level represents the sales amount—in either unit (quantity) or revenue (sales) terms—that is required to cover total costs, consisting of both fixed and variable costs to the company. Total profit at the break-even point is zero. It is only possible for a firm to Break-even, if the dollar value of sales is higher than the variable cost per unit. This means that the selling price of the good needs to be higher than what the company purchased the good, or components of the good for, in order for them to cover the initial price they paid (variable costs). Once the break-even price has been surpassed, the company can start making a profit.
The break-even point is one of the most commonly used concepts of financial analysis and is not only limited to economic use, but can also be utilized by entrepreneurs, accountants, financial planners, managers and even marketers. Break-even points can be useful to all avenues of a business, as it allows employees to identify required outputs and work towards meeting these.
The Breakeven value is not a generic value and will vary dependent on the individual business. Some businesses may have a higher or lower breakeven point, however it is important that each business develop a break-even point calculation, as this will enable them to see the number of units they need to sell to cover their variable costs. Each sale will also make a contribution to the payment of fixed costs as well.
For example, a business that sells tables needs to make annual sales of 200 tables to break-even. At present the company is selling less than 200 tables and is therefore operating at a loss. As a business, they need to consider increasing the amount of tables that they are selling annually in order to make enough money to pay both their fixed and variable costs.
If the business does not think that they can sell the required amount of units, in order to ensure their future viability, they could consider doing the following options:
1. Reduce the fixed costs that they face. This could be done through a number or negotiations, such as reductions in rent, or through better management of bills or other costs faced by the business;
2. Reduce variable costs, for example, finding a new supplier that sells tables thus reducing the amount paid for tables;
3. Increase the quantity of tables that they are selling.
Any of these options have the potential to reduce the break-even point. This means that the business would not need to sell as many tables as before, and would still be able to pay their fixed costs.
Purpose
The main purpose of break-even analysis is to determine the minimum output that must be exceeded in order for a business to make profit. It also is a rough cator of the earnings impact of a marketing activity. A firm is able to analyze their ideal levels of output and therefore be knowledgeable on the amount of sales and revenue they need to generate in order to meet and surpass the break-even point and ensure the survival of the business. If this level is not met, it often becomes difficult for the business to continue to operate and thus they may have to shut down their operations.
The break-even point is one of the simplest, yet least utilized analytical tools by a business’s management team. Identifying a breakeven point helps to provide a dynamic view of the relationships between sales, costs, and profits made. For example, expressing break-even sales as a percentage of actual sales can give managers a chance to understand when to expect to break even (by linking the percent to when in the week/month this percent of sales might occur).
The break-even point is a special case of Target Income Sales, where Target Income is 0 (breaking even). This is very important for financial analysis. Any sales made past the breakeven point can be considered profit (after all initial costs have been paid)
Break-even analysis can also provide data that can be useful to the marketing department of a business as well, as it provides financial goals to the business which can be passed down to marketers in order to try and increase sales.
Not only is the break-even analysis beneficial to the financial side of the business, but it can also provide a chance for operating businesses to see where they could re-structure or cut costs and get the optimum results out of the resources that they have. This may in the long term help the business become more effective and achieve higher returns. In many cases, if an entrepreneurial venture is seeking to get off of the ground and enter into a market it is advised that they formulate a break-even analysis to suggest to potential financial backers that the business has the potential to be viable and at what points.
Construction
In the linear Cost-Volume-Profit Analysis model (where marginal costs and marginal revenues are constant, among other assumptions), the break-even point (BEP) (in terms of Unit Sales (X)) can be directly computed in terms of Total Revenue (TR) and Total Costs (TC) as:

where:
- TFC is Total Fixed Costs,
- P is Unit Sale Price, and
- V is Unit Variable Cost.

The quantity, , is of interest in its own right, and is called the Unit Contribution Margin (C): it is the marginal profit per unit, or alternatively the portion of each sale that contributes to Fixed Costs. Thus the break-even point can be more simply computed as the point where Total Contribution = Total Fixed Cost:


To calculate the break-even point in terms of revenue (a.k.a. currency units, a.k.a. sales proceeds) instead of Unit Sales (X), the above calculation can be multiplied by Price, or, equivalently, the Contribution Margin Ratio (Unit Contribution Margin over Price) can be calculated:

R=C, Where R is revenue generated, C is cost incurred i.e. Fixed costs + Variable Costs or Q * P (Price per unit) = TFC + Q * VC (Price per unit), Q * P - Q * VC = TFC, Q * (P - VC) = TFC, or, Break Even Analysis Q = TFC/c/s ratio=Break Even
Margin of safety
Margin of safety represents the strength of the business. It enables a business to know what is the exact amount it has gained or lost and whether they are over or below the break-even point.[3] In break-even analysis, margin of safety is the extent by which actual or projected sales exceed the break-even sales.[4]
- Margin of safety = (current output - breakeven output)
- Margin of safety% = (current output - breakeven output)/current output × 100
When dealing with budgets you would instead replace "Current output" with "Budgeted output." If P/V ratio is given then profit/PV ratio.
Break-even analysis
By inserting different prices into the formula, you will obtain a number of break-even points, one for each possible price charged. If the firm changes the selling price for its product, from $2 to $2.30, in the example above, then it would have to sell only 1000/(2.3 - 0.6)= 589 units to break even, rather than 715.
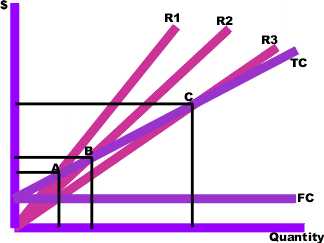
To make the results clearer, they can be graphed. To do this, you draw the total cost curve (TC in the diagram) which shows the total cost associated with each possible level of output, the fixed cost curve (FC) which shows the costs that do not vary with output level, and finally the various total revenue lines (R1, R2, and R3) which show the total amount of revenue received at each output level, given the price you will be charging.
The break-even points (A,B,C) are the points of intersection between the total cost curve (TC) and a total revenue curve (R1, R2, or R3). The break-even quantity at each selling price can be read off the horizontal axis and the break-even price at each selling price can be read off the vertical axis. The total cost, total revenue, and fixed cost curves can each be constructed with simple formula. For example, the total revenue curve is simply the product of selling price times quantity for each output quantity. The data used in these formula come either from accounting records or from various estimation techniques such as regression analysis.
Limitations
- Break-even analysis is only a supply-side (i.e., costs only) analysis, as it tells you nothing about what sales are actually likely to be for the product at these various prices.
- It assumes that fixed costs (FC) are constant. Although this is true in the short run, an increase in the scale of production is likely to cause fixed costs to rise.
- It assumes average variable costs are constant per unit of output, at least in the range of likely quantities of sales. (i.e., linearity).
- It assumes that the quantity of goods produced is equal to the quantity of goods sold (i.e., there is no change in the quantity of goods held in inventory at the beginning of the period and the quantity of goods held in inventory at the end of the period).
- In multi-product companies, it assumes that the relative proportions of each product sold and produced are constant (i.e., the sales mix is constant).
Notes
There is a myth that Black Friday is the annual break-even point in American retail sales, but in fact retailers generally break-even, and indeed profit, nearly every quarter.
See also
References
- ↑ Levine, David; Michele Boldrin (2008-09-07). Against Intellectual Monopoly. Cambridge University Press. p. 312. ISBN 978-0-521-87928-6.
- ↑ Tapang, Bienvenido, and Lorelei Mendoza. Introductory Economics. University of the Philippines, Baguio.
- ↑ The Margin of Safety in MAAW, Chapter 11.
- ↑ Margin of Safety Definition | Formula | Calculation | Example
Further reading
- Dayananda, D.; Irons, R.; Harrison, S.; Herbohn, J.; and P. Rowland, 2002, Capital Budgeting: Financial Appraisal of Investment Projects. Cambridge University Press. pp. 150.
- Dean, Joel. "Cost structures of enterprises and break-even charts." The American Economic Review (1948): 153-164.
- Patrick, A. W. "Some Observations on the Break-Even Chart." Accounting Review (1958): 573-580.
- Tucker, Spencer A. The break-even system: A tool for profit planning. Prentice-Hall, 1963.
- Tucker, Spencer A. Profit planning decisions with the break-even system. Thomond Press: distribution to the book trade in the US by Van Nostrand Reinhold, 1980.
External links
| Wikimedia Commons has media related to Break-even charts. |
- Example of Break Even Point using Microsoft Excel
- MASB Official Website