c-chart
| c-chart | |
|---|---|
| Originally proposed by | Walter A. Shewhart |
| Process observations | |
| Rational subgroup size | n > 1 |
| Measurement type | Number of nonconformances in a sample |
| Quality characteristic type | Attributes data |
| Underlying distribution | Poisson distribution |
| Performance | |
| Size of shift to detect | ≥ 1.5σ |
| Process variation chart | |
| Not applicable | |
| Process mean chart | |
 | |
| Center line | |
| Control limits | |
| Plotted statistic | |


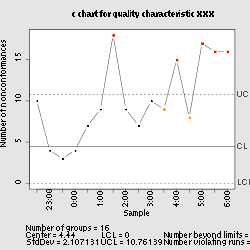
In statistical quality control, the c-chart is a type of control chart used to monitor "count"-type data, typically total number of nonconformities per unit.[1] It is also occasionally used to monitor the total number of events occurring in a given unit of time.
The c-chart differs from the p-chart in that it accounts for the possibility of more than one nonconformity per inspection unit, and that (unlike the p-chart and u-chart) it requires a fixed sample size. The p-chart models "pass"/"fail"-type inspection only, while the c-chart (and u-chart) give the ability to distinguish between (for example) 2 items which fail inspection because of one fault each and the same two items failing inspection with 5 faults each; in the former case, the p-chart will show two non-conformant items, while the c-chart will show 10 faults.
Nonconformities may also be tracked by type or location which can prove helpful in tracking down assignable causes.
Examples of processes suitable for monitoring with a c-chart include:
- Monitoring the number of voids per inspection unit in injection molding or casting processes
- Monitoring the number of discrete components that must be re-soldered per printed circuit board
- Monitoring the number of product returns per day
The Poisson distribution is the basis for the chart and requires the following assumptions:[2]
- The number of opportunities or potential locations for nonconformities is very large
- The probability of nonconformity at any location is small and constant
- The inspection procedure is same for each sample and is carried out consistently from sample to sample
The control limits for this chart type are where is the estimate of the long-term process mean established during control-chart setup.

See also
References
- ↑ "Counts Control Charts". NIST/Sematech Engineering Statistics Handbook. National Institute of Standards and Technology. Retrieved 2008-08-23.
- ↑ Montgomery, Douglas (2005). Introduction to Statistical Quality Control. Hoboken, New Jersey: John Wiley & Sons, Inc. p. 289. ISBN 978-0-471-65631-9. OCLC 56729567.