Catalan parliamentary election, 1999
| | ||||||||||||||||||||||||||||||||||||||||||||||||||||||||||||||||||||||||||||||||||||||||||||||||||||||||
| ||||||||||||||||||||||||||||||||||||||||||||||||||||||||||||||||||||||||||||||||||||||||||||||||||||||||
| ||||||||||||||||||||||||||||||||||||||||||||||||||||||||||||||||||||||||||||||||||||||||||||||||||||||||
|
| ||||||||||||||||||||||||||||||||||||||||||||||||||||||||||||||||||||||||||||||||||||||||||||||||||||||||
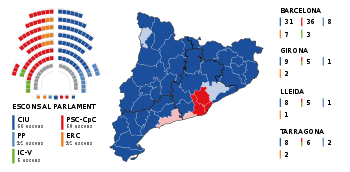
| Graphic of the results in the Catalan Parliament election, 1999, based in seats and constituencies. | ||||||||||||||||||||||||||||||||||||||||||||||||||||||||||||||||||||||||||||||||||||||||||||||||||||||||
| ||||||||||||||||||||||||||||||||||||||||||||||||||||||||||||||||||||||||||||||||||||||||||||||||||||||||
.jpg)
.jpg)
.jpg)


The 1999 Catalan parliamentary election was held on Sunday, 17 October 1999, to elect the 6th Parliament of Catalonia, the regional legislature of the Spanish autonomous community of Catalonia. At stake were all 135 seats in the Parliament, determining the President of Catalonia.
Electoral system
The 135 members of the Parliament of Catalonia were elected in 4 multi-member districts, corresponding to Catalonia's four provinces, using the D'Hondt method and a closed-list proportional representation. As the community did not have an electoral law of its own passed into law at the time of the 1999 election, the electoral system came regulated under the community's Statute of Autonomy rules, and subsidiarily, under the Spanish general electoral law (Organic Law 5/1985, of the General Electoral Regime). As a result of the lack of an autonomous electoral law, seats were allocated to districts through specific Laws or Decrees for each election. For the 1999 election, seats were distributed as follows: Barcelona (85), Girona (17), Lleida (15) and Tarragona (18).
Voting was on the basis of universal suffrage in a secret ballot. Only lists polling above 3% of valid votes in each district (which includes blank ballots—for none of the above) were entitled to enter the seat distribution.[2][3]
Background
Afterwards of 19 years of a Convergence and Union government, this elections expected a big change in a Catalonia Government.
In the past 1995 elections, Convergence and Union lost the absolute majority, but in the parliament voting it was won, because the People's Party of Catalonia and the Socialists' Party of Catalonia abstained in the voting.
In the 1995 elections Initiative for Catalonia Greens and Socialists' Party of Catalonia were to run separately, but in this election formed a party coalition, except in Barcelona.
Parties
- Convergència i Unió (Convergence and Union, CiU). Presidential candidate: Jordi Pujol. Union of the Catalan nationalist, fiscally liberal Democratic Convergence of Catalonia and the conservative Democratic Union of Catalonia.
- Socialists' Party of Catalonia-Citizens for Change-Initiative for Catalonia Greens (PSC-CpC-ICV)*. Presidential candidate: Pasqual Maragall. Social democratic and ecologist. The PSC is affiliated to the Spanish Socialist Workers' Party (PSOE).
- Esquerra Republicana de Catalunya (Republican Left of Catalonia, ERC). Presidential candidate: Josep-Lluís Carod-Rovira. Catalan republican and independentist, left-wing.
- People's Party of Catalonia (PPC). Presidential candidate: Alberto Fernández Díaz. The main party of the centre-right in Spain.
- Initiative for Catalonia Greens (ICV). Presidential candidate: Rafael Ribó'. Green (eco-socialist) and leftist.
- United and Alternative Left (EUiA). Presidential candidate: Antoni Lucchetti. The Catalan referent of the Spanish United Left.
Opinion polls
Vote
Poll results are listed in the table below in reverse chronological order, showing the most recent first, and using the date the survey's fieldwork was done, as opposed to the date of publication. If such date is unknown, the date of publication is given instead. The highest percentage figure in each polling survey is displayed in bold, and the background shaded in the leading party's colour. In the instance that there is a tie, then no figure is shaded. The lead column on the right shows the percentage-point difference between the two parties with the highest figures. When a specific poll does not show a data figure for a party, the party's cell corresponding to that poll is shown empty.
| Date | Polling Firm/Source | CiU | PSC | PPC | ICV | ERC | Oth. | Lead |
|---|---|---|---|---|---|---|---|---|
| 17 Oct 1999 | Regional Election | 37.7 | 37.9 | 9.5 | 2.5 | 8.7 | 3.7 | 0.2 |
| 17 Oct | Ipsos-Eco | 37.4 | 36.7 | 9.6 | 3.2 | 8.5 | 4.6 | 0.7 |
| 17 Oct | Opitel | 40.0 | 37.5 | 9.0 | 4.5 | 7.0 | 2.0 | 2.5 |
| 17 Oct | Sigma-2 | 37.7 | 36.5 | 10.0 | 3.2 | 9.1 | 3.5 | 1.2 |
| Exit polls | ||||||||
| 10 Oct | Metra-6 | 36.2 | 34.1 | 11.4 | 6.0 | 8.3 | 4.0 | 2.1 |
| 10 Oct | DYM | 40.5 | 30.3 | 11.3 | 5.6 | 9.7 | 2.6 | 10.2 |
| 10 Oct | Demoscopia | 40.1 | 36.6 | 10.7 | 3.2 | 7.7 | 1.7 | 3.5 |
| 10 Oct | Sigma-2 | 40.4 | 35.7 | 10.2 | 2.6 | 7.7 | 3.4 | 4.7 |
| 2–7 Oct | Ipsos-Eco | 37.2 | 32.9 | 12.1 | 8.9 | 6.7 | 2.2 | 4.3 |
| 5–6 Oct | Ipsos-Eco | 36.5 | 32.7 | 12.4 | 8.9 | 7.2 | 2.3 | 3.8 |
| 4–6 Oct | Opina | 39.0 | 36.0 | 10.5 | 4.0 | 7.5 | 3.0 | 3.0 |
| 3–4 Oct | Ipsos-Eco | 36.2 | 33.1 | 11.8 | 9.6 | 7.4 | 1.8 | 3.1 |
| 16 Sep–3 Oct | CIS | 38.6 | 31.7 | 11.7 | 9.7 | 4.5 | 3.8 | 6.9 |
| 28 Sep–2 Oct | Ipsos-Eco | 36.8 | 34.6 | 11.9 | 8.3 | 6.1 | 2.3 | 2.2 |
| 28–29 Sep | Ipsos-Eco | 36.4 | 35.1 | 12.1 | 7.9 | 6.2 | 2.3 | 1.3 |
| 15–21 Sep | DYM | 42.8 | 34.3 | 10.7 | w. PSC | 8.7 | 3.5 | 8.5 |
| 19 Sep | Line-Staff | 42.6 | 34.1 | 9.0 | 2.0 | 10.2 | 2.1 | 8.5 |
| 19 Sep | Demoscopia | 38.8 | 37.6 | 10.6 | 3.7 | 7.0 | 2.3 | 1.2 |
| 13 Sep | La Vanguardia[lower-alpha 1] | 37.0 | 36.7 | 11.0 | 4.3 | 7.8 | 3.2 | 0.3 |
| 7–9 Sep | Sigma-2 | 40.4 | 33.9 | 10.0 | 3.6 | 7.5 | 4.6 | 6.5 |
| 30–31 Aug | Opina | 38.0 | 36.0 | 10.5 | 5.0 | 7.5 | 3.0 | 2.0 |
| 13 Jun 1999 | EP Election | 29.3 | 34.6 | 16.9 | 5.4 | 6.1 | 7.7 | 5.3 |
| 29 Apr–1 May | Opina | 39.0 | 31.0 | 15.0 | 6.0 | 7.0 | 2.0 | 8.0 |
| 21 Feb | La Vanguardia[lower-alpha 1] | 33.6 | 34.1 | 16.1 | 5.7 | 5.7 | 4.8 | 0.5 |
| 1999 | ||||||||
| 11–12 Dec | Opina | 38.0 | 31.0 | 16.0 | 6.0 | 6.0 | 3.0 | 7.0 |
| 19–20 Jun | Opina | 39.5 | 28.0 | 14.0 | 6.5 | 7.0 | 5.0 | 11.5 |
| 6 Mar | Opina | 39.5 | 27.0 | 13.5 | 7.0 | 6.5 | 6.5 | 12.5 |
| 1998 | ||||||||
| 3–4 Nov | Opina | 42.5 | 23.0 | 14.0 | 7.5 | 7.5 | 5.5 | 19.5 |
| 18–19 Jun | Opina | 41.0 | 23.0 | 15.0 | 9.0 | 7.5 | 4.5 | 18.0 |
| 7–8 Mar | Opina | 39.5 | 25.5 | 15.0 | 9.0 | 7.0 | 4.0 | 14.0 |
| 1997 | ||||||||
| 3 Mar 1996 | General Election | 29.6 | 39.4 | 18.0 | 7.6 | 4.2 | 1.2 | 9.8 |
| 1996 | ||||||||
| 19 Nov 1995 | Regional Election | 40.9 | 24.9 | 13.1 | 9.7 | 9.5 | 1.9 | 16.0 |
Seat projectionss
Opinion polls showing seat projections are displayed in the table below. The highest seat figures in each polling survey have their background shaded in the leading party's colour. In the instance that there is a tie, then no figure is shaded. 68 seats were required for an absolute majority in the Parliament of Catalonia.
| Date | Polling Firm/Source | CiU | PSC | PPC | ICV | ERC | Others | |
|---|---|---|---|---|---|---|---|---|
| 17 Oct 1999 | Regional Election | 56 | 52 | 12 | 3 | 12 | 0 | |
| 17 Oct | Ipsos-Eco | 55−57 | 50−52 | 12−14 | 3−4 | 11−13 | 0 | |
| 17 Oct | Opitel | 57−58 | 50−52 | 11−12 | 4 | 10−12 | 0 | |
| 17 Oct | Sigma-2 | 55−59 | 49−51 | 13 | 3 | 11−13 | 0 | |
| Exit polls | ||||||||
| 10 Oct | Metra-6 | 53−56 | 48−50 | 14−16 | 6−7 | 10−12 | 0 | |
| 10 Oct | DYM | 57−63 | 40−46 | 14−15 | 5−6 | 12−15 | 0 | |
| 10 Oct | Demoscopia | 58−60 | 48−50 | 13−14 | 3 | 10 | 0 | |
| 10 Oct | Sigma-2 | 58−62 | 48−50 | 12−14 | 3 | 10 | 0 | |
| 2–7 Oct | Ipsos-Eco | 53−55 | 45−47 | 15−16 | 7−8 | 12−13 | 0 | |
| 5–6 Oct | Ipsos-Eco | 52−55 | 45−47 | 15−16 | 8 | 12−13 | 0 | |
| 4–6 Oct | Opina | 56−58 | 51−52 | 13 | 4 | 9−10 | 0 | |
| 3–4 Oct | Ipsos-Eco | 52−54 | 45−47 | 14−15 | 8 | 13−14 | 0 | |
| 16 Sep–3 Oct | CIS | 57−59 | 45−47 | 14−15 | 4−5 | 11−13 | 0 | |
| 28 Sep–2 Oct | Ipsos-Eco | 53−55 | 47−48 | 14−15 | 7 | 12 | 0 | |
| 28–29 Sep | Ipsos-Eco | 52−54 | 46−48 | 14−15 | 7 | 12 | 0 | |
| 15–21 Sep | DYM | 60−65 | 42−46 | 11−15 | 1−4 | 11−14 | 0 | |
| 19 Sep | Line-Staff | 61−62 | 49 | 12 | 0 | 12−13 | 0 | |
| 19 Sep | Demoscopia | 55−58 | 50−52 | 13−14 | 4 | 10−11 | 0 | |
| 13 Sep | La Vanguardia[lower-alpha 1] | 52−58 | 47−57 | 13−14 | 3−4 | 9−12 | 0 | |
| 7–9 Sep | Sigma-2 | 58−63 | 46−48 | 13 | 4 | 9−12 | 0 | |
| 5 Sep | Line-Staff | 57−58 | 47 | 13−14 | 5 | 12 | 0 | |
| 30–31 Aug | Opina | 55−56 | 49−51 | 13−14 | 4−6 | 10−11 | 0 | |
| 29 Apr–1 May | Opina | 58 | 44 | 19 | 6 | 8 | 0 | |
| 21 Feb | La Vanguardia[lower-alpha 1] | 47−57 | 44−55 | 21 | 5−6 | 7 | 0 | |
| 1999 | ||||||||
| 11–12 Dec | Opina | 57 | 44 | 21 | 6 | 7 | 0 | |
| 19–20 Jun | Opina | 61 | 41 | 19 | 6 | 8 | 0 | |
| 6 Mar | Opina | 61 | 40 | 18 | 8 | 8 | 0 | |
| 1998 | ||||||||
| 3–4 Nov | Opina | 65 | 33 | 19 | 8 | 10 | 0 | |
| 1997 | ||||||||
| 1996 | ||||||||
| 19 Nov 1995 | Regional Election | 60 | 34 | 17 | 11 | 13 | 0 | |
Results
Overall
 | ||||||
| Party | Vote | Seats | ||||
|---|---|---|---|---|---|---|
| Votes | % | ±pp | Won | +/− | ||
| Socialists' Party of Catalonia-Citizens for Change (PSC-CpC) | 1,183,299 | 37.85 | |
52 | | |
| Convergence and Union (CiU) | 1,178,420 | 37.70 | |
56 | | |
| People's Party of Catalonia (PPC) | 297,265 | 9.51 | |
12 | | |
| Republican Left of Catalonia (ERC) | 271,173 | 8.67 | |
12 | | |
| Initiative for Catalonia-Greens (IC-V) | 78,441 | 2.51 | |
3 | | |
| United and Alternative Left (EUiA) | 44,454 | 1.42 | New | 0 | ±0 | |
| The Greens-Ecologist Confederation of Catalonia (EV-CEC) | 22,797 | 0.73 | |
0 | ±0 | |
| The Greens-Green Alternative (EV-AV) | 8,254 | 0.26 | New | 0 | ±0 | |
| Parties with less than 0.1% of the vote | 13,019 | 0.42 | – | 0 | ±0 | |
|---|---|---|---|---|---|---|
| Internationalist Socialist Workers' Party (POSI) | 2,784 | 0.09 | New | 0 | ±0 | |
| Catalan State (EC) | 1,774 | 0.06 | New | 0 | ±0 | |
| Humanist Party (PH) | 1,327 | 0.04 | New | 0 | ±0 | |
| Spanish Falange of the JONS (FE-JONS) | 1,281 | 0.04 | |
0 | ±0 | |
| Democratic and Social Centre (CDS) | 1,161 | 0.04 | New | 0 | ±0 | |
| Natural Law Party (PLN) | 1,029 | 0.03 | New | 0 | ±0 | |
| UNIC-FIC (UNIC-FIC) | 881 | 0.03 | New | 0 | ±0 | |
| Bounced Public Workers (TPR) | 833 | 0.03 | New | 0 | ±0 | |
| Espinalist Party (PE) | 799 | 0.03 | New | 0 | ±0 | |
| Internationalist Fight (LI (LIT-CI)) | 485 | 0.02 | New | 0 | ±0 | |
| Federal Democratic Union (UFD) | 447 | 0.01 | New | 0 | ±0 | |
| Catalans in the World (CAM) | 110 | 0.00 | New | 0 | ±0 | |
| Democratic Party of the People (PDEP) | 108 | 0.00 | ±0.00 | 0 | ±0 | |
| Blank ballots | 28,968 | 0.93 | ||||
| Total | 3,126,090 | 100.00 | 135 | ±0 | ||
| Valid votes | 3,126,090 | 99.75 | |
|||
| Invalid votes | 7,836 | 0.25 | | |||
| Votes cast / turnout | 3,133,926 | 59.20 | | |||
| Abstentions | 2,159,731 | 40.80 | | |||
| Registered voters | 5,293,657 | |||||
| Source(s): | ||||||
Results by province
| Party | BC | GI | LL | TA | Total | |||||||||||||||||
|---|---|---|---|---|---|---|---|---|---|---|---|---|---|---|---|---|---|---|---|---|---|---|
| PSC | S | 36 | 5 | 5 | 6 | 52 | ||||||||||||||||
| V | 40.0 | 29.2 | 29.5 | 34.1 | 37.9 | |||||||||||||||||
| CiU | S | 31 | 9 | 8 | 8 | 56 | ||||||||||||||||
| V | 35.1 | 48.6 | 48.1 | 41.3 | 37.7 | |||||||||||||||||
| PPC | S | 8 | 1 | 1 | 2 | 12 | ||||||||||||||||
| V | 9.9 | 6.1 | 8.0 | 10.6 | 9.5 | |||||||||||||||||
| ERC | S | 7 | 2 | 1 | 2 | 12 | ||||||||||||||||
| V | 7.7 | 12.8 | 11.6 | 10.5 | 8.7 | |||||||||||||||||
| ICV | S | 3 | 3 | |||||||||||||||||||
| V | 3.3 | 2.5 | ||||||||||||||||||||
| Others | V | 3.1 | 2.4 | 1.8 | 2.6 | 2.8 | ||||||||||||||||
| Blank | 0.9 | 0.9 | 1.0 | 0.9 | 0.9 | |||||||||||||||||
| Total seats | 85 | 17 | 15 | 18 | 135 | |||||||||||||||||
| Turnout | 58.9 | 62.2 | 60.8 | 58.3 | 59.2 | |||||||||||||||||
Results by comarques
| Comarque | PSC | CiU | PPC | ERC | ICV | Lead | Turnout |
|---|---|---|---|---|---|---|---|
| Alt Camp | 29.8 | 44.4 | 6.3 | 16.1 | −14.6 | 63.6 | |
| Alt Empordà | 30.8 | 47.4 | 7.9 | 10.9 | −16.6 | 60.2 | |
| Alt Penedès | 31.9 | 47.4 | 5.7 | 10.8 | 2.1 | −15.5 | 65.0 |
| Alt Urgell | 24.6 | 49.9 | 6.4 | 17.3 | −25.3 | 60.3 | |
| Alta Ribagorça | 41.1 | 42.2 | 5.9 | 9.0 | −1.1 | 59.3 | |
| Anoia | 33.8 | 45.5 | 6.7 | 8.8 | 2.3 | −11.7 | 61.5 |
| Bages | 30.1 | 47.9 | 4.9 | 12.2 | 2.4 | −17.8 | 63.5 |
| Baix Camp | 33.4 | 40.9 | 10.0 | 12.1 | −7.5 | 55.2 | |
| Baix Ebre | 31.3 | 44.3 | 12.2 | 9.5 | −13.0 | 57.1 | |
| Baix Empordà | 32.5 | 48.3 | 5.1 | 11.1 | −15.8 | 61.2 | |
| Baix Llobregat | 48.1 | 27.6 | 9.5 | 5.7 | 4.3 | +20.5 | 56.3 |
| Baix Penedès | 40.5 | 39.7 | 9.1 | 7.9 | +0.8 | 59.5 | |
| Barcelonès | 41.3 | 32.0 | 12.2 | 7.2 | 3.4 | +9.3 | 59.9 |
| Berguedà | 26.0 | 51.2 | 4.4 | 14.8 | 1.6 | −25.2 | 66.2 |
| Cerdanya | 26.0 | 51.2 | 6.0 | 14.0 | −25.2 | 60.2 | |
| Conca de Barberà | 21.0 | 49.9 | 5.9 | 17.9 | −28.9 | 65.0 | |
| Garraf | 39.0 | 37.8 | 8.7 | 7.9 | 3.7 | +1.2 | 56.1 |
| Garrigues | 24.2 | 50.0 | 6.4 | 17.5 | −25.8 | 68.2 | |
| Garrotxa | 23.4 | 56.1 | 4.4 | 13.4 | −32.7 | 67.1 | |
| Gironès | 31.7 | 42.9 | 6.7 | 14.7 | −11.2 | 63.7 | |
| Maresme | 33.0 | 43.3 | 8.8 | 9.2 | −10.3 | 61.7 | |
| Montsià | 31.5 | 49.5 | 8.2 | 8.1 | −18.0 | 59.7 | |
| Noguera | 24.4 | 53.7 | 7.0 | 12.2 | −29.3 | 66.8 | |
| Osona | 18.6 | 56.8 | 3.9 | 16.1 | 2.4 | −38.2 | 68.1 |
| Pallars Jussà | 30.5 | 50.0 | 5.0 | 12.5 | −19.5 | 60.9 | |
| Pallars Sobirà | 30.9 | 51.1 | 4.9 | 10.9 | −20.2 | 67.8 | |
| Pla de l'Estany | 15.7 | 57.1 | 4.6 | 20.0 | −37.1 | 68.1 | |
| Pla d'Urgell | 25.8 | 52.5 | 6.7 | 12.7 | −26.7 | 68.7 | |
| Priorat | 27.8 | 46.0 | 6.3 | 16.9 | −18.2 | 72.1 | |
| Ribera d'Ebre | 31.3 | 48.9 | 6.9 | 10.4 | −17.6 | 68.0 | |
| Ripollès | 25.9 | 55.5 | 3.3 | 12.7 | −29.6 | 69.7 | |
| Segarra | 21.1 | 53.6 | 6.9 | 15.6 | −32.5 | 64.3 | |
| Segrià | 35.3 | 42.8 | 9.7 | 8.9 | −7.5 | 58.5 | |
| Selva | 29.1 | 49.2 | 6.3 | 11.5 | −20.1 | 60.7 | |
| Solsonès | 17.5 | 57.8 | 5.9 | 15.9 | −40.3 | 66.2 | |
| Tarragonès | 38.8 | 34.5 | 13.9 | 8.8 | +4.3 | 58.1 | |
| Terra Alta | 25.1 | 49.1 | 14.2 | 9.4 | −24.0 | 66.4 | |
| Urgell | 22.5 | 54.2 | 6.9 | 13.8 | −31.7 | 65.2 | |
| Val d'Aran | 38.3 | 44.5 | 12.6 | 2.7 | −6.2 | 58.1 | |
| Vallès Occidental | 42.6 | 33.7 | 8.4 | 7.1 | 3.6 | +8.9 | 57.5 |
| Vallès Oriental | 37.9 | 40.5 | 7.5 | 7.6 | 2.8 | −2.6 | 59.1 |
| Barcelona | 40.0 | 35.1 | 9.9 | 7.7 | 3.3 | +4.9 | 58.9 |
| Girona | 29.2 | 48.6 | 6.1 | 12.8 | −19.4 | 62.2 | |
| Lleida | 29.5 | 48.1 | 8.0 | 11.6 | −18.6 | 60.8 | |
| Tarragona | 34.1 | 41.3 | 10.6 | 10.5 | −7.2 | 58.3 | |
| TOTAL | 37.9 | 37.7 | 9.5 | 8.7 | 2.5 | +0.2 | 59.2 |
Post-election
Investiture voting
| Investiture voting for Jordi Pujol (CiU) Absolute majority: 68/135 | ||
| Vote | Parties | Votes |
| | CiU (56), PP (12) | 68 / 135 |
| No | PSC (52), ICV (3) | 55 / 135 |
| Abstentions | ERC (12) | 12 / 135 |
| Source: Historia Electoral | ||
Notes
References
| Parliamentary elections | |
|---|---|
| General elections | |
| Referendums | |