Causal loop diagram

A causal loop diagram (CLD) is a causal diagram that aids in visualizing how different variables in a system are interrelated. The diagram consists of a set of nodes and edges. Nodes represent the variables and edges are the links that represent a connection or a relation between the two variables. A link marked positive indicates a positive relation and a link marked negative indicates a negative relation. A positive causal link means the two nodes change in the same direction, i.e. if the node in which the link starts decreases, the other node also decreases. Similarly, if the node in which the link starts increases, the other node increases as well. A negative causal link means the two nodes change in opposite directions, i.e. if the node in which the link starts increases, the other node decreases and vice versa.
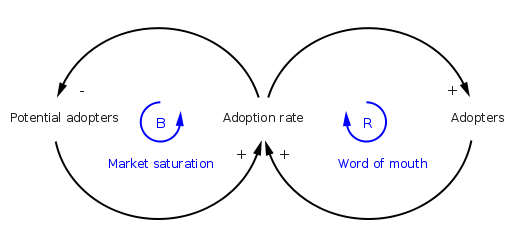
Closed cycles in the diagram are very important features of the CLDs. A closed cycle is either defined as a reinforcing or balancing loop. A reinforcing loop is a cycle in which the effect of a variation in any variable propagates through the loop and returns to the variable reinforcing the initial deviation i.e. if a variable increases in a reinforcing loop the effect through the cycle will return an increase to the same variable and vice versa. A balancing loop is the cycle in which the effect of a variation in any variable propagates through the loop and returns to the variable a deviation opposite to the initial one i.e. if a variable increases in a balancing loop the effect through the cycle will return a decrease to the same variable and vice versa.
If a variable varies in a reinforcing loop the effect of the change reinforces the initial variation. The effect of the variation will then create another reinforcing effect. Without breaking the loop the system will be caught in a vicious cycle of circular chain reactions. For this reason, closed loops are critical features in the CLDs.
Example of positive reinforcing loop:
The amount of the Bank Balance will affect the amount of the Earned Interest, as represented by the top blue arrow, pointing from Bank Balance to Earned Interest.
Since an increase in Bank balance results in an increase in Earned Interest, this link is positive, which is denoted with a ""+"".
The Earned interest gets added to the Bank balance, also a positive link, represented by the bottom blue arrow.
The causal effect between these nodes forms a positive reinforcing loop, represented by the green arrow, which is denoted with an "R".[1]
History
The use of nodes and arrows to construct directed graph models of cause and effect dates back to the invention of path analysis by Sewall Wright in 1918, long before System Dynamics. Due to the limitations of genetic data, however, these early causal graphs contained no loops — they were directed acyclic graphs. The first formal use of Causal Loop Diagrams was explained by Dr. Dennis Meadows at a conference for educators (Systems Thinking & Dynamic Modeling Conference for K-12 Education in New Hampshire sponsored by Creative Learning Exchange [2]).
Meadows explained that when he and others were working on the World3 model (circa 1970–72), they realized they would not be able to use the computer output to explain how the feedback loops worked in their model when presenting their results to others. They decided to show feedback loops (without the stocks, flows and every variable), using arrows connecting the names of major model components in the feedback loops. This may have been the first formal use of Causal Loop Diagrams.[3]
Positive and negative causal links
- Positive causal link means that the two nodes change in the same direction, i.e. if the node in which the link starts decreases, the other node also decreases. Similarly, if the node in which the link starts increases, the other node increases.
- Negative causal link means that the two nodes change in opposite directions, i.e. if the node in which the link starts increases, then the other node decreases, and vice versa.
Example
Reinforcing and balancing loops
To determine if a causal loop is reinforcing or balancing, one can start with an assumption, e.g. "Node 1 increases" and follow the loop around. The loop is:
- reinforcing if, after going around the loop, one ends up with the same result as the initial assumption.
- balancing if the result contradicts the initial assumption.
Or to put it in other words:
- reinforcing loops have an even number of negative links (zero also is even, see example below)
- balancing loops have an odd number of negative links.
Identifying reinforcing and balancing loops is an important step for identifying Reference Behaviour Patterns, i.e. possible dynamic behaviours of the system.
- Reinforcing loops are associated with exponential increases/decreases.
- Balancing loops are associated with reaching a plateau.
If the system has delays (often denoted by drawing a short line across the causal link), the system might fluctuate.
Example
See also
- Bayesian network
- Directed acyclic graph
- Negative feedback
- Path analysis (statistics)
- Positive feedback
- System dynamics
References
- ↑ John D.Sterman, Business Dynamics: Systems Thinking and Modeling for a Complex World. McGraw Hill/Irwin, 2000. ISBN 9780072389159
- ↑ http://www.clexchange.org/
- ↑ Anecdote by Richard Turnock attending informal discussion where Dennis Meadows explained origin of CLD
External links
| Wikimedia Commons has media related to Causal loop diagram. |