Central England temperature
The Central England Temperature (CET) record is a meteorological dataset originally published by Professor Gordon Manley in 1953 and subsequently extended and updated in 1974, following many decades of painstaking work. The monthly mean surface air temperatures, for the Midlands region of England, are given (in degrees Celsius) from the year 1659 to the present.
This record represents the longest series of monthly temperature observations in existence. It is a valuable dataset for meteorologists and climate scientists. It is monthly from 1659, and a daily version has been produced from 1772. The monthly means from November 1722 onwards are given to a precision of 0.1 °C. The earliest years of the series, from 1659 to October 1722 inclusive, for the most part only have monthly means given to the nearest degree or half a degree, though there is a small 'window' of 0.1 degree precision from 1699 to 1706 inclusive. This reflects the number, accuracy, reliability and geographical spread of the temperature records that were available for the years in question.
Data quality
Although best efforts have been made by Manley and subsequent researchers to quality control the series, there are data problems in the early years, with some non-instrumental data used. These problems account for the lower precision to which the early monthly means were quoted by Manley. Parker et al. (1992) [1] addressed this by not using data prior to 1772, since their daily series required more accurate data than did the original series of monthly means. Before 1722, instrumental records do not overlap and Manley used a non-instrumental series from Utrecht compiled by Labrijn (1945), to make the monthly central England temperature (CET) series complete. Between 1723 and the 1760s most observations were taken not from outside measurements but from indoor readings in unheated rooms, and thus are of little or no use.
For recent years there are two versions of the series: the "official" version maintained by the Hadley Centre, and a version maintained by Philip Eden which he argues is more consistent with the series as originally compiled by Manley.[2]
Trends revealed by the series
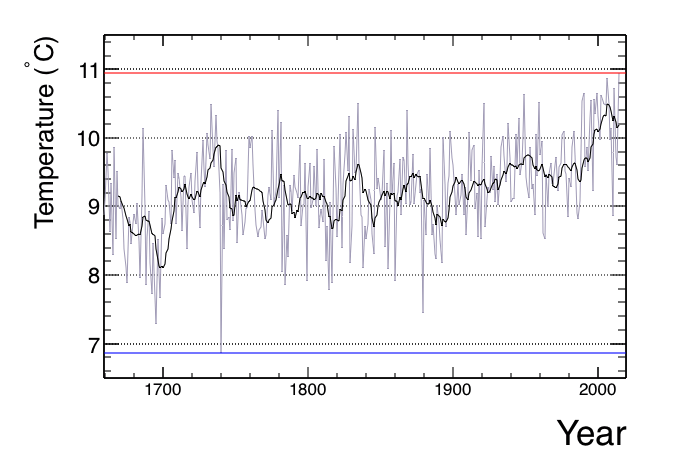
During the eighteenth and nineteenth centuries, a cool period which coincided with snowy winters and generally cool summers, the temperatures fluctuated widely but with little trend. From 1910, temperatures increased slightly until about 1950 when they flattened before a sharp rising trend began in about 1975. Temperatures in the most recent decade (years 2001-2010) were slightly higher in all seasons than the long-term average.[3]
Extrema
Taking the 355-year period for the series as a whole:
Hottest
| Period | Record Mean | Year |
|---|---|---|
| Year | 10.95 °C (51.71 °F) | 2014 [4] |
| Spring (March–May) | 10.23 °C (50.41 °F) | 2011 |
| Summer (June–August) | 17.77 °C (63.99 °F) | 1976 |
| Autumn (September–November) | 12.63 °C (54.73 °F) | 2006 |
| Winter (December–February) | 6.77 °C (44.19 °F) | 1868/1869 |
| January | 7.5 °C (45.5 °F) | 1916 |
| February | 7.9 °C (46.2 °F) | 1779 |
| March | 9.2 °C (48.6 °F) | 1957 |
| April | 11.8 °C (53.2 °F) | 2011 |
| May | 15.1 °C (59.2 °F) | 1833 |
| June | 18.2 °C (64.8 °F) | 1846 |
| July | 19.7 °C (67.5 °F) | 2006 |
| August | 19.2 °C (66.6 °F) | 1995 |
| September | 16.8 °C (62.2 °F) | 2006 |
| October | 13.3 °C (55.9 °F) | 2001 |
| November | 10.1 °C (50.2 °F) | 1994 |
| December | 9.7 °C (49.5 °F) | 2015 |
Coldest
| Period | Record Mean | Year |
|---|---|---|
| Year | 6.86 °C (44.35 °F) | 1740 |
| Spring (March–May) | 5.63 °C (42.13 °F) | 1837 |
| Summer (June–August) | 13.10 °C (55.58 °F) | 1725 |
| Autumn (September–November) | 7.50 °C (45.50 °F) | 1676 |
| Winter (December–February) | −1.17 °C (29.89 °F) | 1683/1684 |
| January | −3.1 °C (26.4 °F) | 1795 |
| February | −1.9 °C (28.6 °F) | 1947 |
| March | 1.0 °C (33.8 °F) | 1674 |
| April | 4.7 °C (40.5 °F) | 1701 and 1837 |
| May | 8.5 °C (47.3 °F) | 1698 |
| June | 11.5 °C (52.7 °F) | 1675 |
| July | 13.4 °C (56.1 °F) | 1816 |
| August | 12.9 °C (55.2 °F) | 1912 |
| September | 10.5 °C (50.9 °F) | 1674, 1675, 1694 and 1807 |
| October | 5.3 °C (41.5 °F) | 1740 |
| November | 2.3 °C (36.1 °F) | 1782 |
| December | −0.8 °C (30.6 °F) | 1890 |
See also
Notes
- ↑ Parker, D. E., T. P. Legg, and C. K. Folland, 1992: A new daily Central England Temperature Series, 1772-1991. Int J Climatol, 12, 317-342.
- ↑ Checking the CET
- ↑ CET Data; Mean annual temperature for 2001 to 2010 is 10.22°C compared to warmest decade of 20th century -the 1990s - 10.06°C, and the warmest decade of the period 1659 to 1900 - the 1730s - 9.54°
- ↑ Mean CET, 2014
References
- G. Manley, "Central England temperatures: monthly means 1659 to 1973.", Quarterly J. of the Royal Meteorological Society, vol. 100, pp. 389–405 (1974).
- D.E. Parker, T.P. Legg and C. Folland, "A new daily Central England Temperature series 1772-1991," Int. J. Climatol., vol. 12, pp. 317–342 (1992).
- Graphs of the series at the University of East Anglia
- Freely downloadable text file containing the data.
- Met Office Hadley Centre CET pages