Statistics relating to enlargement of the European Union
 |
| Chart of the population development of the EU affiliated with the enlargement process. |
This is a sequence of tables giving statistical data for past and future enlargements of the European Union. All data refer to the populations, land areas, and gross domestic products (GDP) of the respective countries at the time of their accession to the European Union, illustrating historically-accurate changes to the Union. The GDP figures are at purchasing power parity, in United States dollar at 1990 prices.
Past enlargements
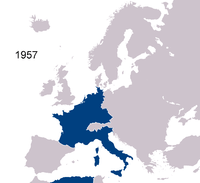
Foundation
| Member countries | Population | Area (km²) | GDP (billion US$) |
GDP per capita (US$) |
|---|---|---|---|---|
| |
9,052,707 | 30,528 | 58.316 | $46,878 |
| |
44,788,852 | 674,843 | 312.966 | $40,690 |
| |
54,292,038 | 248,717 | 400.554 | $41,168 |
| |
49,476,000 | 301,336 | 265.192 | $30,116 |
| |
310,291 | 2,586 | 2.938 | $113,533 |
| |
11,186,847 | 41,526 | 83.351 | $50,355 |
| EC6 (1958) | 169,106,736 | 1,299,536 | 1,123.317 | 6,643 |
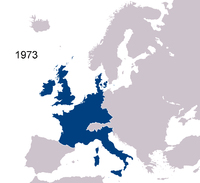
1973 enlargement
| Member countries | Population | Area (km²) | GDP (billion US$) |
GDP per capita (US$) |
|---|---|---|---|---|
| |
5,021,861 | 43,094 | 70.032 | $59,928 |
| |
3,073,200 | 70,273 | 21.103 | $39,638 |
| |
56,210,000 | 244,820 | 675.941 | $36,728 |
| Accession countries | 64,305,061 | 358,187 | 767.076 | 11,929 |
| Existing members (1973) | 192,457,106 | 1,299,536 | 2,381,396 | 12,374 |
| EC9 (1973) | 256,762,167 (+33.41%) |
1,657,723 (+25.44%) |
3,148.472 (+32.21%) |
12,262 (−0.91%) |
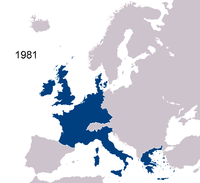
1981 enlargement
| Member countries | Population | Area (km²) | GDP (billion US$) |
GDP per capita (US$) |
|---|---|---|---|---|
| |
9,729,350 | 131,945 | 86.553 | 8,896 |
| Existing members (1981) | 261,743,191 | 1,657,723 | 3,694,558 | 14,115 |
| EC10 (1981) | 271,472,541 (+3.72%) |
1,789,668 (+7.96%) |
3,781.111 (+2.34%) |
13,928 (−1.33%) |
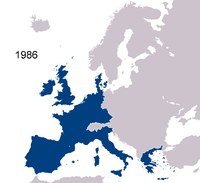
1986 enlargement
| Member countries | Population | Area (km²) | GDP (billion US$) |
GDP per capita (US$) |
|---|---|---|---|---|
| |
9,907,411 | 92,391 | 85.610 | 8,641 |
| |
38,707,556 | 504,782 | 386.998 | 9,998 |
| Accession countries | 48,614,967 | 597,173 | 472.608 | 9,721 |
| Existing members (1986) | 273,398,552 | 1,789,668 | 4,186.176 | 15,312 |
| EC12 (1986) EU12 (1993) |
366,867,431 (+17.53%) |
2,386,841 (+33.37%) |
4,658,784 (+11.29%) |
14,468 (−5.51%) |
1990 enlargement
| Member countries | Population | Area (km2) | GDP (billion US$) |
GDP per capita (US$) |
|---|---|---|---|---|
| |
16,111,000 | 108,333 | 159.5 | 9,800 |
| Existing members (1986) | 273,398,552 | 1,789,668 | 4,186.176 | 15,312 |
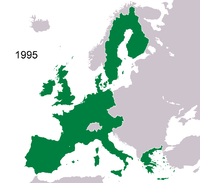
1995 enlargement
| Member countries | Population | Area (km²) | GDP (billion US$) |
GDP per capita (US$) |
|---|---|---|---|---|
| |
8,206,524 | 83,871 | 145.238 | 18,048 |
| |
5,261,008 | 338,145 | 80.955 | 15,859 |
| |
9,047,752 | 449,964 | 156.640 | 17,644 |
| Accession countries | 22,029,977 | 871,980 | 382.833 | 17,378 |
| Existing members (1995) | 350,909,402 | 2,495,174 | 5,894.232 | 16,797 |
| EU15 (1995) | 372,939,379 (+6.28%) |
3,367,154 (+34.95%) |
6,277.065 (+6.50%) |
16,831 (+0.20%) |
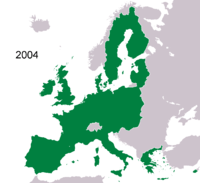
2004 enlargement
| Member countries | Population | Area (km²) | GDP (billion US$) |
GDP per capita (US$) |
|---|---|---|---|---|
| |
775,927 | 9,250 | 11.681 | 15,054 |
| |
10,246,178 | 78,866 | 105.248 | 10,272 |
| |
1,341,664 | 45,226 | 22.384 | 16,684 |
| |
10,032,375 | 93,030 | 102,183 | 10,185 |
| |
2,306,306 | 64,589 | 24.826 | 10,764 |
| |
3,607,899 | 65,200 | 31.971 | 8,861 |
| |
396,851 | 316 | 5.097 | 12,843 |
| |
38,580,445 | 311,904 | 316.438 | 8,202 |
| |
5,423,567 | 49,036 | 42.800 | 7,810 |
| |
2,011,473 | 20,273 | 29.633 | 14,732 |
| Accession countries | 74,722,685 | 737,690 | 685.123 | 9,169 |
| Existing members (2004) | 381,781,620 | 3,367,154 | 7,711.871 | 20,200 |
| EU25 (2004) | 456,504,305 (+19.57%) |
4,104,844 (+17.97%) |
8,396,994 (+8.88%) |
18,394 (−8.94%) |
2007 enlargement

| Member countries | Population | Area (km²) | GDP (billion US$) |
GDP per capita (US$) |
|---|---|---|---|---|
| |
7,761,000 | 111,002 | 62.29 | 8,026 |
| |
22,329,977 | 238,391 | 204.4 | 9,153 |
| Accession countries | 30,090,977 | 349,393 | 266.69 | 8,863 |
| Existing members (2007) | 464,205,901 | 4,104,844 | 12,170.11 | 26,217 |
| EU27 (2007) | 494,296,878 (+6.48%) |
4,454,237 (+8.51%) |
12,436.80 (+2.04%) |
25,160.59 (−4.03%) |
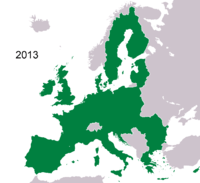
2013 enlargement
| Member countries | Population | Area (km²) | GDP (billion US$) |
GDP per capita (US$) |
|---|---|---|---|---|
| |
4,290,612 | 56,594 | 80.983 | 18,338 |
| Existing members (2012) | 503,492,041 | 4,454,237 | 15,821.00 | 31,607 |
| EU28 | 506,777,111 (+0.85%) |
4,510,831 (+1.31%) |
15,868.983 (+0.51%) |
31,313.54 (−0.74%) |
Candidate countries
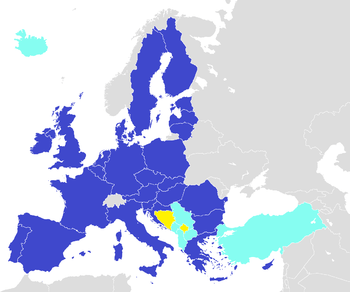
EU28 (2013)
| Member Countries | Population | Area (km²) | GDP (billion US$) |
GDP per capita (US$) |
|---|---|---|---|---|
| |
506,777,111 | 4,510,831 | 17,868.983 | 31,313.54 |
Iceland
| Member countries | Population | Area (km²) | GDP (billion US$) |
GDP per capita (US$) |
|---|---|---|---|---|
| |
318,452 | 103,001 | 12.831 | 39,223 |
| EU29 (EU28 + Iceland) |
507,095,563 (+0.06%) |
4,613,832 (+2.28%) |
15,881.814 (+0.08%) |
31,319.17 (+0.02%) |
Macedonia
| Member countries | Population | Area (km²) | GDP (billion US$) |
GDP per capita (US$) |
|---|---|---|---|---|
| |
2,055,004 | 25,713 | 20.821 | 10,112 |
| EU29 (EU28 + Macedonia) |
508,832,115 (+0.41%) |
4,536,544 (+0.57%) |
15,889.804 (+0.13%) |
31,227.99 (-0.27%) |
Turkey
| Member countries | Population | Area (km²) | GDP (billion US$) |
GDP per capita (US$) |
|---|---|---|---|---|
| |
78,741,000 | 783,562 | 1,116.005 | 15,340 |
| EU29 (EU28 + Turkey) |
581,501,380 (+14.74%) |
5,294,393 (+17.37%) |
16984.988 (+7.03%) |
29,208.85 (-6.72%) |
Montenegro
| Member countries | Population | Area (km²) | GDP (billion US$) |
GDP per capita (US$) |
|---|---|---|---|---|
| |
625,266 | 13,812 | 7.029 | 11,228 |
| EU29 (EU28 + Montenegro) |
507,402,377 (+0.12%) |
4,524,643 (+0.31%) |
15876.012 (+0.04%) |
31,288.80 (-0.08%) |
Serbia
| Member countries | Population | Area (km²) | GDP (billion US$) |
GDP per capita (US$) |
|---|---|---|---|---|
| |
7,120,666 | 88,361 | 79.013 | 10,661 |
| EU29 (EU28 + Serbia) |
513,897,777 (+1.41%) |
4,599,192 (+1.96%) |
15,947.996 (+0.5%) |
31,033.40 (-3.89%) |
All Candidates
| Member countries | Population | Area (km²) | GDP (billion US$) |
GDP per capita (US$) |
|---|---|---|---|---|
| |
88,910,000 | 1,043,197 | 1,266.699 | 14,564.42 |
| EU33 | 595,750,000 (+16.74%) |
5,554,028 (+22.49%) |
17,135.682 (+7.79%) |
28,911.56 (-7.67%) |
Note: All data sourced from individual country entries on Wikipedia. Presumed source CIA World Factbook 2011. Populations usually 2011 estimates; historical/future estimates not used. Figures are approximate due to fluctuations in population and economies.
See also
Footnotes
1. ^ Algeria was part of France until 1962.
2. ^ German reunification in 1990 led to the inclusion of the territory of the former German Democratic Republic. This enlargement is not explicitly mentioned. Data for Germany in all tables is from current statistics.
3. ^ Greenland left the EC in 1985.
4. ^ Officially the whole of Cyprus lies within the European Union. "In light of Protocol 10 of the Accession Treaty 2003 Cyprus as a whole entered the EU, whereas the acquis is suspended in the northern part of the island ("areas not under effective control of the Government of the Republic of Cyprus"). This means inter alia that these areas are outside the customs and fiscal territory of the EU. The suspension has territorial effect, but does not concern the personal rights of Turkish Cypriots as EU citizens, as they are considered as citizens of the Member State Republic of Cyprus".
References
- "Total Economy Database". Groningen Growth and Development Centre. January 2007. Retrieved 2007-12-05.
- ↑ "European Commission—Enlargement—Potential Candidates". Retrieved 28 October 2011.
- ↑ "European Commission—Enlargement—Potential Candidates". Retrieved 28 October 2011.