El Tor, Egypt
| El Tor الطور | |
|---|---|
 | |
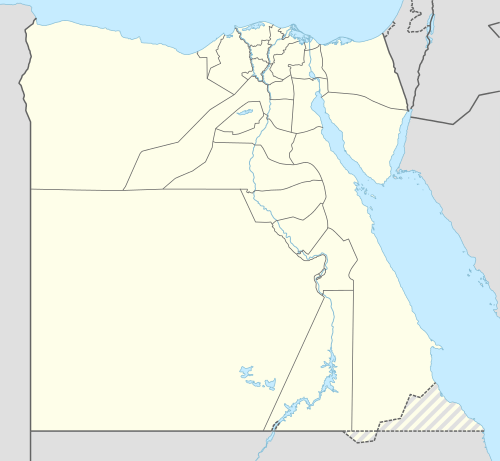 El Tor Location in Egypt | |
| Coordinates: 28°14′30″N 33°37′20″E / 28.24167°N 33.62222°ECoordinates: 28°14′30″N 33°37′20″E / 28.24167°N 33.62222°E | |
| Country |
|
| Governorate | South Sinai |
| Elevation | 4 m (13 ft) |
| Population (2012) | |
| • Total | 32,877 |
| Time zone | EST (UTC+2) |
| Area code(s) | (+20) 65 |
El Tor (Arabic: الطور aṭ-Ṭūr / et-Ṭūr Egyptian Arabic pronunciation: [etˈtˤuːɾ]), also transliterated as Al-Tur and At-Tur and known as Tur Sinai, formerly Raithu, is the capital of South Sinai Governorate of Egypt. The name of the city comes from the Arabic name of the mountain where the prophet Moses received the tablets from God; this mountain is called Jabal Al Tor.
The El Tor strain of cholera was discovered there in 1905. It was a quarantine camp for Pilgrims returning from Hajj.
The Raithu desert is situated around El Tor, between Saint Catherine and the Red Sea. It is part of the Archdiocese of Mount Sinai and Raithu of the Eastern Orthodox Patriarchate of Jerusalem. The "Martyrs of Raithu" were 43 anchorites slain by nomadic tribes during the reign of Emperor Diocletian. Christian monks fleeing persecutions had been present since the 3rd century, and the Raithu monastery (or Rutho) was commissioned in the 6th century by Byzantine emperor Justinian. The latter was proposed as a UNESCO World Heritage site on November 1, 1994 in the Cultural category.[1]
Climate
Its climate is classified by Köppen-Geiger system as hot desert (BWh).
| Climate data for El Tor | |||||||||||||
|---|---|---|---|---|---|---|---|---|---|---|---|---|---|
| Month | Jan | Feb | Mar | Apr | May | Jun | Jul | Aug | Sep | Oct | Nov | Dec | Year |
| Record high °C (°F) | 28.8 (83.8) |
29.7 (85.5) |
35.9 (96.6) |
38.9 (102) |
42.6 (108.7) |
42.4 (108.3) |
42.5 (108.5) |
40.5 (104.9) |
38.2 (100.8) |
35.6 (96.1) |
31.7 (89.1) |
28.7 (83.7) |
42.6 (108.7) |
| Average high °C (°F) | 20.9 (69.6) |
21.9 (71.4) |
24.2 (75.6) |
28.0 (82.4) |
31.0 (87.8) |
32.3 (90.1) |
33.2 (91.8) |
33.3 (91.9) |
31.0 (87.8) |
28.2 (82.8) |
25.3 (77.5) |
22.3 (72.1) |
27.6 (81.7) |
| Daily mean °C (°F) | 16.1 (61) |
17.0 (62.6) |
19.9 (67.8) |
23.4 (74.1) |
26.2 (79.2) |
27.9 (82.2) |
28.9 (84) |
29.1 (84.4) |
27.6 (81.7) |
24.5 (76.1) |
20.7 (69.3) |
17.4 (63.3) |
23.2 (73.8) |
| Average low °C (°F) | 9.5 (49.1) |
10.2 (50.4) |
13.5 (56.3) |
17.2 (63) |
20.3 (68.5) |
23.1 (73.6) |
24.0 (75.2) |
24.8 (76.6) |
23.2 (73.8) |
19.1 (66.4) |
14.4 (57.9) |
11.4 (52.5) |
17.6 (63.7) |
| Record low °C (°F) | 2.6 (36.7) |
4.2 (39.6) |
5.6 (42.1) |
8.8 (47.8) |
13.2 (55.8) |
18.4 (65.1) |
20.3 (68.5) |
20.7 (69.3) |
17.2 (63) |
10.5 (50.9) |
7.0 (44.6) |
5.8 (42.4) |
2.6 (36.7) |
| Average precipitation mm (inches) | 0 (0) |
0 (0) |
0 (0) |
0 (0) |
0 (0) |
0 (0) |
0 (0) |
0 (0) |
0 (0) |
1 (0.04) |
1 (0.04) |
5 (0.2) |
7 (0.28) |
| Average precipitation days (≥ 1.0 mm) | 0 | 0 | 0 | 0 | 0 | 0 | 0 | 0 | 0 | 0 | 0 | 0.1 | 0.1 |
| Average relative humidity (%) | 53 | 51 | 53 | 55 | 56 | 57 | 59 | 63 | 66 | 61 | 58 | 55 | 57.2 |
| Source #1: NOAA[2] | |||||||||||||
| Source #2: Climate Charts[3] | |||||||||||||
References
- ↑ Rutho Monastery - UNESCO World Heritage Centre Retrieved on 2009-03-26.
- ↑ "El–Tor Climate Normals 1961–1990". National Oceanic and Atmospheric Administration. Retrieved October 25, 2015.
- ↑ "El Tor, Egypt Climate, Global Warming, and Daylight Charts and Data". Climate Charts. Retrieved 12 August 2013.