Equatorial electrojet
The equatorial electrojet (EEJ) is a narrow ribbon of current flowing eastward in the day time equatorial region of the Earth's ionosphere. The abnormally large amplitude of variations in the horizontal components measured at equatorial geomagnetic observatories, as a result of EEJ, was noticed as early as 1920 from Huancayo geomagnetic observatory. Observations by radar, rockets, satellites, and geomagnetic observatories are used to study EEJ.
Causes
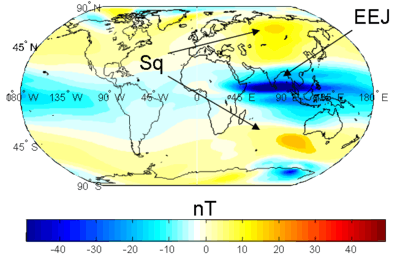
The worldwide solar-driven wind results in the so-called Sq (solar quiet) current system in the E region of the Earth's ionosphere (100–130 km altitude). Resulting from this current is an electrostatic field directed east-west (dawn-dusk) in the equatorial day side of the ionosphere. At the magnetic dip equator, where the geomagnetic field is horizontal, this electric field results in an enhanced eastward current flow within ±3 degrees of the magnetic equator, known as the equatorial electrojet (EEJ).
Studies of the EEJ from satellite and ground magnetic data
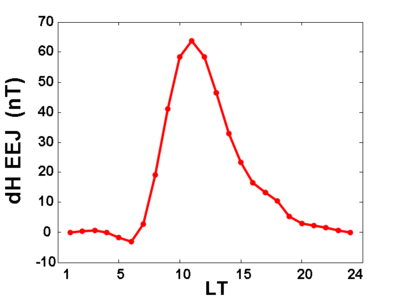
The EEJ phenomenon was first identified using geomagnetic data. The amplitude of the daily variation of the horizontal magnetic intensity (ΔH) measured at a geomagnetic observatory near the dip-equator is 3–5 fold higher than the variation of data from other regions of Earth. A typical diurnal equatorial observatory data show a peak of strength ~80 nT at 12:00 LT, with respect to the night-time level. Egedal (1947) showed that the enhancement of quiet day solar daily variations in ΔH (Sq(H)) lay within the 50 latitude centered on the dip equator. The mechanism that produced the variation in the magnetic field was proposed as a band of current about 300 km in width flowing over the dip equator.
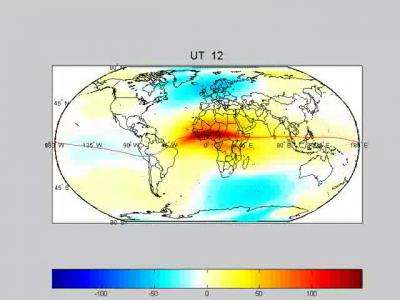
EEJ studies from satellite data were initiated with the arrival of data from the POGO (Polar Orbiting Geophysical Observatories) series of satellite (1967–1970). The characteristic signature of the EEJ is a sharp negative V-shaped curve in the H field, attaining its minimum within 0.5° of the magnetic dip equator. The magnetic data from satellite missions like Ørsted (1999–present) and CHAMP (2000–present) have vastly improved our knowledge of the EEJ.

Recent studies have focused on the lunar-solar interaction is the EEJ. It was demonstrated that complexity is introduced into the EEJ due to the interaction between lunar tide variability in the equatorial electric field and solar-driven variability in the E-region conductivity. [1]
References
- Egedal, J. 1947. The magnetic diurnal variation of the horizontal force near the magnetic equator. Terr. Magn. Atmos. Electr. 52, 449 – 451
- Sabaka, T., N. Olsen, and M. Purucker (2004) Extending Comprehensive Models of the Earth's Magnetic Field with Oersted and CHAMP data, Geophys. J. Int.,159, 521-547.
- Gasperini, F., J. Forbes (2014) Lunar-Solar Interactions in the Equatorial Electrojet, Geophys. Res. Lett., doi: 10.1002/2014GL059294.
- J. J. Love (February 2008). "Magnetic monitoring of Earth and space" (PDF). Physics Today.
- The Equatorial Electrojet By C. Agodi Onwumechili, Published 1997 CRC Press, ISBN 90-5699-069-1, https://books.google.com/books?id=kwCFPH4C3tEC
- Sabaka, T., N. Olsen, and M. Purucker (2004) Extending Comprehensive Models of the Earth's Magnetic Field with Oersted and CHAMP data, Geophys. J. Int.,159, 521-547.
- ↑ Gasperini, F.; Forbes, J. M. (February 2014). "Lunar-Solar Interactions in the Equatorial Electrojet". Geophysical Research Letters: n/a–n/a. doi:10.1002/2014GL059294.