Faqirwali
| Faqirwali | |
|---|---|
|
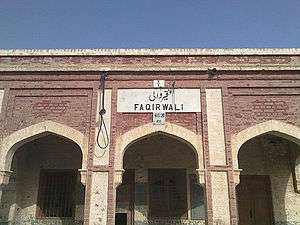
Faqirwali's historic Railway Station | |
 Faqirwali | |
| Coordinates: 29°28′N 73°02′E / 29.47°N 73.04°ECoordinates: 29°28′N 73°02′E / 29.47°N 73.04°E | |
| Country |
|
| Province | Punjab |
| Elevation | 114 m (374 ft) |
| Time zone | PST (UTC+5) |
| Postal code | 62050 |
| Dialing code | 063 |
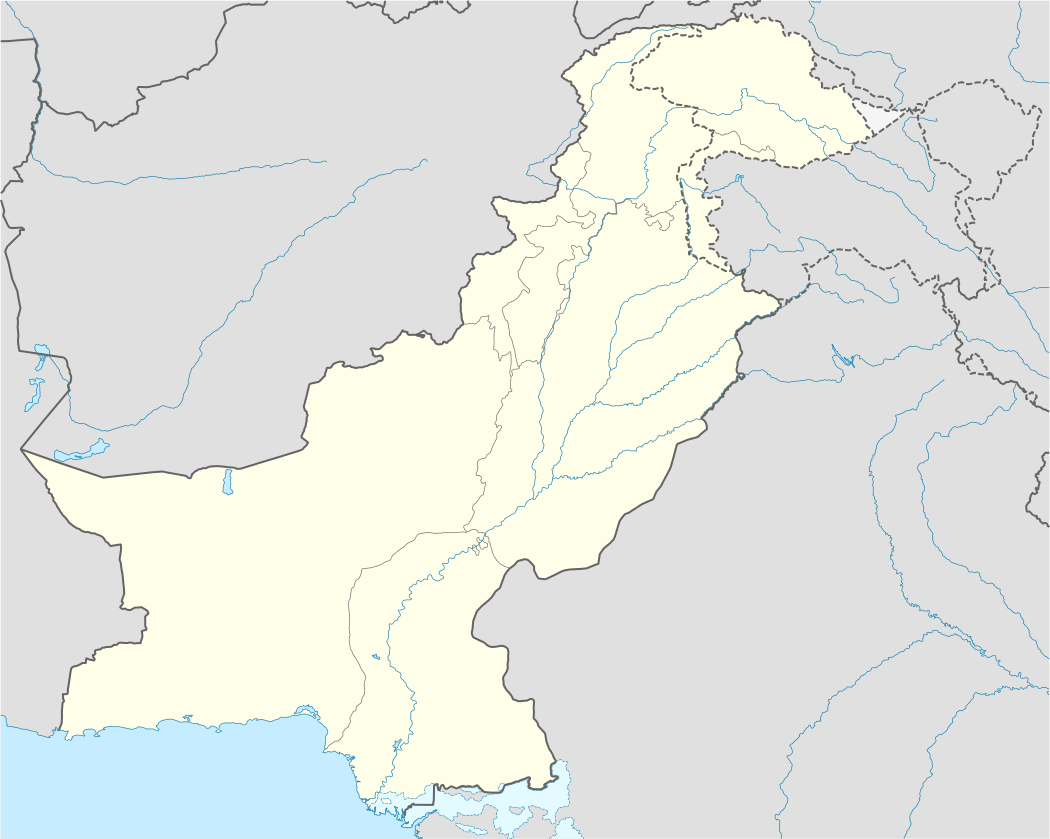
Faqirwali (Urdu: فقِيروالى), is a town of Bahawalnagar District in the Punjab province of eastern Pakistan...
Climate
The average climate of Faqirwali is hot and humid. The temperature extremes occur during the months of May, June, and July, when the temperature reaches up to 49-53 °C. In August, the monsoon seasons starts, with heavy rainfall throughout the area. December and January are the coldest months, when temperatures can drop up to -1 °C. The annual average rainfall is 160 mm.
| Climate data for Faqirwali | |||||||||||||
|---|---|---|---|---|---|---|---|---|---|---|---|---|---|
| Month | Jan | Feb | Mar | Apr | May | Jun | Jul | Aug | Sep | Oct | Nov | Dec | Year |
| Record high °C (°F) | 29.3 (84.7) |
35.6 (96.1) |
39.4 (102.9) |
45.6 (114.1) |
48.0 (118.4) |
50.1 (122.2) |
46.0 (114.8) |
42.4 (108.3) |
42.0 (107.6) |
40.0 (104) |
37.0 (98.6) |
29.6 (85.3) |
50.1 (122.2) |
| Average high °C (°F) | 20.6 (69.1) |
22.76 (72.97) |
28.3 (82.9) |
35.9 (96.6) |
40.8 (105.4) |
42.0 (107.6) |
38.3 (100.9) |
37.4 (99.3) |
36.5 (97.7) |
34.2 (93.6) |
28.6 (83.5) |
22.5 (72.5) |
32.322 (90.173) |
| Daily mean °C (°F) | 13.3 (55.9) |
15.7 (60.3) |
21.0 (69.8) |
28.0 (82.4) |
32.8 (91) |
35.1 (95.2) |
33.1 (91.6) |
32.4 (90.3) |
30.6 (87.1) |
26.4 (79.5) |
20.6 (69.1) |
15.0 (59) |
25.33 (77.6) |
| Average low °C (°F) | 5.8 (42.4) |
8.4 (47.1) |
13.8 (56.8) |
20.0 (68) |
24.7 (76.5) |
28.2 (82.8) |
27.8 (82) |
27.4 (81.3) |
24.7 (76.5) |
18.6 (65.5) |
12.6 (54.7) |
7.6 (45.7) |
18.3 (64.94) |
| Record low °C (°F) | 0.0 (32) |
−1.0 (30.2) |
3.9 (39) |
12.6 (54.7) |
14.4 (57.9) |
18.3 (64.9) |
16.1 (61) |
21.4 (70.5) |
13.1 (55.6) |
11.0 (51.8) |
4.0 (39.2) |
1.7 (35.1) |
−1 (30.2) |
| Average precipitation mm (inches) | 4.5 (0.177) |
16.5 (0.65) |
15.2 (0.598) |
10.2 (0.402) |
4.8 (0.189) |
15.3 (0.602) |
77.2 (3.039) |
39.9 (1.571) |
9.5 (0.374) |
1.0 (0.039) |
4.3 (0.169) |
5.0 (0.197) |
203.4 (8.007) |
| Mean monthly sunshine hours | 222.4 | 218.9 | 250.8 | 274.3 | 269.1 | 213.9 | 218.3 | 256.6 | 279.3 | 284.0 | 260.8 | 223.5 | 2,971.9 |
| Source: NOAA (1971–1990) "Bahawalnagar Climate Normals 1971–1990". National Oceanic and Atmospheric Administration. Retrieved January 16, 2013. | |||||||||||||
References
This article is issued from Wikipedia - version of the 6/28/2016. The text is available under the Creative Commons Attribution/Share Alike but additional terms may apply for the media files.

