Forming limit diagram
A forming limit diagram, also known as a forming limit curve, is used in sheet metal forming for predicting forming behaviour of sheet metal.[1][2] The diagram attempts to provide a graphical description of material failure tests, such as a punched dome test.
In order to determine whether a given region has failed, a mechanical test is performed. The mechanical test is performed by placing a circular mark on the workpiece prior to deformation, and then measuring the post-deformation ellipse that is generated from the action on this circle. By repeating the mechanical test to generate a range of stress states, the formability limit diagram can be generated as a line at which failure is onset (see also formability).
Description
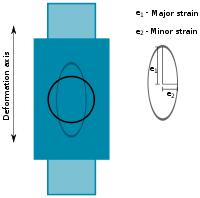
The semi-axes of the ellipse formed in this circle allow for the measurement of relative strain in two primary directions, known as the major and minor directions, which correspond to the major and minor semi-axes of the ellipse. Under the assumption of path independent strain, the relative strains will reach a critical value at which deformations occur. Through repeated measurements, the shape of the curve can be obtained experimentally. Alternately, a formability limit diagram can be generated by mapping the shape of a failure criterion into the formability limit domain. [3] How ever the diagram is obtained, the resultant diagram provides a tool for the determination as to whether a given forming process will result in failure or not. Such information is critical in the design of forming processes, and is therefore fundamental to the design of sheet metal forming processes. Through the establishment of forming limit diagrams for a range of alloys, the forming process and alloy behavior can be matched at the metalworking design time by the process engineer.
Modern determination
With the availability and use of optical strain measurement system in combination with digital data processing forming limit curves can be acquired in a more automatic and productive way compared to the classic way as described above. This procedure has been standardized and is contained in an ISO document (12004). [4]
In order to obtain a full forming limit curve, test pieces with different geometries are drawn by a punch (e. g. with a diameter of 100 mm) until fracture occurs. Friction is almost zero by using a complex tribo-system with foils and grease between sheet and tool. By use of an optical strain measurement system spatial strain paths are evaluated immediately before failure of the test piece. Using an interpolation method for the strain variation between the severely deformed and necked area – the limits of this area are computed by a sign change of the second derivative of the strain distribution – the major and minor strain values are obtained. Using an averaged value for several cross-section evaluations and 3 test samples for the same geometry a strain pair (one point in the forming limit diagram) as forming limit is identified.
It is recognized by some authors that the nature of fracture and formability is intrinsically non-deterministic, since large variations might be observed even within a single experimental campaign.[5] Therefore, the concepts of Forming Limit Bands and Forming Limit Maps have been introduced.
Influence parameters
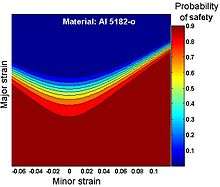
Forming limit curves (FLC) for four steel sheet grades are displayed in the attached figure. All forming limit curves have essentially the same shape. A minimum of the curve exists at the intercept with the major strain axis or close thereby, the plane strain forming limit. With the definition of the onset of local necking (e. g. membrane force reaches an extreme value) and the assumption of a hardening law according to Hollomon (σ = K εn) it can be shown that the corresponding theoretical plane strain forming limit is identical with the strain hardening coefficient, n. There is no thickness effect. Taking into account the strain rate sensitivity of the material, which is obvious in steel, along with the sheet thickness, the fact can be explained that practical forming limits, obtained by the use of the above described method, lie well above theoretical forming limits. Thus the basic influence parameters for the forming limits are, the strain hardening exponent, n, the initial sheet thickness, t0 and the strain rate hardening coefficient, m. The lankford coefficient, r, which defines the plastic anisotropy of the material, has two effects on the forming limit curve. On the left side there is no influence except that the curve extends to larger values, on the right hand side increasing r values reduce the forming limits.[6]
M-K method
There is a widely used method for computation of FLCs, introduced by Marciniak in 1967. It assumes an inclined band in the investigated plane sheet piece with smaller thickness which denotes an imperfection. With this model limit strains can be calculated numerically. The advantage of this method is that any material model can be used and limits can also be obtained for nonproportional forming. However there is one drawback. Calculated forming limits are sensitive to the imperfection value. With the assumption of a strain rate sensitive material model realistic forming limits may be obtained which lie above theoretical limit strains. Basically with this calculation method smooth forming limit curves are generated for materials for which only one experimental value exists. A good overview of state of the art about FLC calculation methods is given in the proceedings of a conference held in Zurich in 2006 and the Numisheet conference in 2008.[7][8]
Use of FLCs
For many years forming limit curves have been used in order to assess the sheet material formability. They have been applied in the design stage of tools using the finite element method as a simulation tool which is widely used in a production environment...
See also
References
- ↑ Marciniak, Z.; Duncan, J. L.; Hu, S. J. (2002). Mechanics of sheet metal forming. Butterworth-Heinemann. p. 75. ISBN 0-7506-5300-0.
- ↑ Llewellyn, D. T.; Hudd, Roger C. (1998). Steels: metallurgy and applications. Butterworth-Heinemann. p. 28. ISBN 0-7506-3757-9.
- ↑ Pearce, R.: “Sheet Metal Forming”, Adam Hilger, 1991, ISBN 0-7503-0101-5.
- ↑ ISO TC 164/SC 2 N 477, ISO/CD 12004-2, Metallic materials — Sheet and strip - Determination of forming limit curves — Part 2: Determination of forming limit curves in laboratory, Jan 26th, 2006.
- ↑ Strano, M.; Colosimo, B.M. (30 April 2006). "Logistic regression analysis for experimental determination of forming limit diagrams". International Journal of Machine Tools and Manufacture. 46 (6): 673–682. doi:10.1016/j.ijmachtools.2005.07.005.
- ↑ Koistinen, D. P.; Wang, N.-M. edts.: „Mechanics of Sheet Metal Forming – Material Behavior and Deformation analysis“, Plenum Press, 1978, ISBN 0-306-40068-5.
- ↑ Gese, H. and Dell, H.: “Numerical Prediction of the FLC with the Program Crach”, FLC Zurich 06, Zurich, March 15 – 16th, 2006.
- ↑ Hora, P.: “Numisheet 2008 – Proceedings of the 7th Int. Conf. and Workshop on Numerical Simulation of 3D Sheet Metal Forming Processes”, Sept. 1-5, 2008, Interlaken, Switzerland.