Galbraith plot
In statistics, a Galbraith plot (also known as Galbraith's radial plot or just radial plot), is one way of displaying several estimates of the same quantity that have different standard errors.[1]
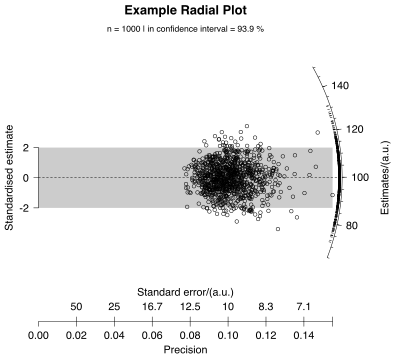
Example for Galbraith's radial plot.
It can be used to examine heterogeneity in a meta-analysis, as an alternative or supplement to a forest plot.
A Galbraith plot is produced by first calculating the standardized estimates or z-statistics by dividing each estimate by its standard error (SE). The Galbraith plot is then a scatter plot of each z-statistic (vertical axis) against 1/SE (horizontal axis). Larger studies (with smaller SE and larger 1/SE) will be observed to aggregate away from the origin.[2]
See also
References
- ↑ Galbraith, Rex (1988). "Graphical display of estimates having differing standard errors". Technometrics. Technometrics, Vol. 30, No. 3. 30 (3): 271–281. doi:10.2307/1270081. JSTOR 1270081.
- ↑ University of York, Department of Health sciences MSc course material
External links
- Galbraith plots are available within the metafor package in R, along with various other diagnostic and summary plots.
- MIX 2.0 Software to perform meta-analysis and create Galbraith plots in Excel.
- RadialPlotter Java application for fission track, luminescence and other radial plots from P. Vermeesch.
- RadialPlotter() function within the R package 'numOSL' from Peng Jun for statistical age models analysis in optically stimulated luminescence dating.
- plot_RadialPlot() function within the R package 'Luminescence' to produce Galbraith plots.
Further reading
- Galbraith, R.F., 1990. The radial plot: Graphical assessment of spread in ages. International Journal of Radiation Applications and Instrumentation. Part D. Nuclear Tracks and Radiation Measurements, 17 (3), pp. 207–214. doi: 10.1016/1359-0189(90)90036-W
- Galbraith, R. & Green, P., 1990. Estimating the component ages in a finite mixture. International Journal of Radiation Applications and Instrumentation. Part D. Nuclear Tracks and Radiation Measurements, 17 (3), pp. 197–206. doi: 10.1016/1359-0189(90)90035-V
- Galbraith, R.F. & Laslett, G.M., 1993. Statistical models for mixed fission track ages. Nuclear Tracks And Radiation Measurements, 21 (4), pp. 459–470. doi: 10.1016/1359-0189(93)90185-C
- Galbraith, R.F., 1994. Some Applications of Radial Plots. Journal of the American Statistical Association, 89 (428), pp. 1232–1242. http://www.jstor.org/stable/2290987
- Galbraith, R.F., 2010. On plotting OSL equivalent doses. Ancient TL, 28 (1), pp. 1–10. PDF on Ancient TL website
- Galbraith, R.F. & Roberts, R.G., 2012. Statistical aspects of equivalent dose and error calculation and display in OSL dating: An overview and some recommendations. Quaternary Geochronology, 11, pp. 1–27. doi: 10.1016/j.quageo.2012.04.020
This article is issued from Wikipedia - version of the 8/10/2016. The text is available under the Creative Commons Attribution/Share Alike but additional terms may apply for the media files.