Hayes and Harlington (UK Parliament constituency)
| Hayes and Harlington | |
|---|---|
|
Borough constituency for the House of Commons | |
|
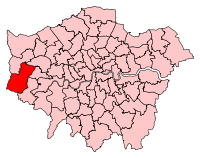
Boundary of Hayes and Harlington in Greater London. | |
| County | Greater London |
| Electorate | 70,589 (December 2010)[1] |
| Major settlements | Harlington, Hayes, West Drayton, Yeading, Yiewsley |
| Current constituency | |
| Created | 1950 |
| Member of parliament | John McDonnell (Labour) |
| Number of members | One |
| Created from | Southall (Hayes and Harlington part) Uxbridge (West Drayton and Yiewsley part) |
| Overlaps | |
| European Parliament constituency | London |
Hayes and Harlington is a constituency[n 1] in Greater London represented in the House of Commons of the UK Parliament since 1997 by John McDonnell of the Labour Party, the current Shadow Chancellor of the Exchequer since 13 September 2015.[n 2]
Heathrow Villages is a ward of the London Borough of Hillingdon. The population of this ward at the 2011 Census was 12,199.[2]
Boundaries
1950-1974: The Urban District of Hayes and Harlington.
1974-1983: The London Borough of Hillingdon wards of Belmore, Frogmore, Hayes, South, and Yeading.
1983-2010: The London Borough of Hillingdon wards of Barnhill, Botwell, Charville, Crane, Harlington, Heathrow, Townfield, Wood End, and Yeading.
2010-present: The London Borough of Hillingdon wards of Barnhill, Botwell, Charville, Heathrow Villages, Pinkwell, Townfield, West Drayton, and Yeading.
Constituency profile
In the south of the constituency is Heathrow Airport, which is the largest single provider of employment including its many associated businesses, such as retail, international distribution, cargo handling and parking throughout the seat and nearby.[3] This area, which makes up the south of the borough, has an income level of earnings slightly below national and Greater London averages. Among its working age population, the most dominant occupation sectors are manufacturing, distribution, self-employed trades and light industry.[4]
History
The seat traditionally, since its 1950 creation was a safe Labour seat (and its predecessor from World War II) until 1981, when its Labour MP, Neville Sandelson, defected to the now Liberal-merged Social Democratic Party.[n 3] Sandelson stood for election for the new party in 1983 which led to a three-way split in the vote, less at the expense of the less affiliated party, which enabled the Conservative Terry Dicks to gain the seat in 1983 and retain it in the next two General Elections, with marginal majorities. In 1997, the seat swung heavily back to the Labour Party with the 17.5% swing to the winning party being almost double that seen nationally (of 10% average swing), and has had safe Labour majorities in the elections since.
Members of Parliament
| Election | Member[5] | Party | |
|---|---|---|---|
| 1950 | Walter Ayles | Labour | |
| 1953 by-election | Arthur Skeffington | Labour | |
| 1971 by-election | Neville Sandelson | Labour | |
| 1981 | SDP | ||
| 1983 | Terry Dicks | Conservative | |
| 1997 | John McDonnell | Labour | |
Election results
Elections in the 2010s
| Party | Candidate | Votes | % | ± | |
|---|---|---|---|---|---|
| Labour | John McDonnell | 26,843 | 59.6 | +4.7 | |
| Conservative | Pearl Lewis | 11,143 | 24.7 | -4.7 | |
| UKIP | Cliff Dixon | 5,388 | 12.0 | N/A | |
| Liberal Democrat | Satnam Kaur Khalsa | 888 | 2.0 | -6.8 | |
| Green | Alick Munro | 794 | 1.8 | +0.9 | |
| Majority | 15,700 | 34.8 | +9.4 | ||
| Turnout | 45,056 | 60.2 | -0.5 | ||
| Labour hold | Swing | +4.7 | |||
| Party | Candidate | Votes | % | ± | |
|---|---|---|---|---|---|
| Labour | John McDonnell | 23,377 | 54.8 | -3.9 | |
| Conservative | Scott Seaman-Digby | 12,553 | 29.4 | +4.2 | |
| Liberal Democrat | Satnam Kaur Khalsa | 3,726 | 8.7 | -1.1 | |
| BNP | Chris Forster | 1,520 | 3.6 | +1.1 | |
| National Front | Andy Cripps | 566 | 1.3 | N/A | |
| English Democrat | Cliff Dixon | 464 | 1.1 | N/A | |
| Green | Jessica Lee | 348 | 0.8 | -0.6 | |
| Christian | Aneel Shahzad | 83 | 0.2 | N/A | |
| Majority | 10,824 | 25.4 | |||
| Turnout | 42,637 | 60.7 | +5.4 | ||
| Labour hold | Swing | -4.1 | |||
Elections in the 2000s
| Party | Candidate | Votes | % | ± | |
|---|---|---|---|---|---|
| Labour | John McDonnell | 19,009 | 58.7 | -7.0 | |
| Conservative | Richard Worrall | 8,162 | 25.2 | +1.1 | |
| Liberal Democrat | Jon Ball | 3,174 | 9.8 | +3.8 | |
| BNP | Tony Hazel | 830 | 2.6 | +0.4 | |
| UKIP | Martin Haley | 552 | 1.7 | N/A | |
| Green | Brian Outten | 442 | 1.4 | N/A | |
| Independent | Paul Goddard | 220 | 0.7 | N/A | |
| Majority | 10,847 | 33.5 | |||
| Turnout | 32,389 | 56.3 | 0.0 | ||
| Labour hold | Swing | -4.1 | |||
| Party | Candidate | Votes | % | ± | |
|---|---|---|---|---|---|
| Labour | John McDonnell | 21,279 | 65.7 | +3.7 | |
| Conservative | Robert McLean | 7,813 | 24.1 | -3.1 | |
| Liberal Democrat | Nahid Boethe | 1,958 | 6.0 | -1.4 | |
| BNP | Gary Birch | 705 | 2.2 | N/A | |
| Socialist Alternative | Walter Kennedy | 648 | 2.0 | N/A | |
| Majority | 13,466 | 41.6 | |||
| Turnout | 32,403 | 56.3 | -16.1 | ||
| Labour hold | Swing | +1.4 | |||
Elections in the 1990s
| Party | Candidate | Votes | % | ± | |
|---|---|---|---|---|---|
| Labour | John McDonnell | 25,458 | 62.0 | +17.2 | |
| Conservative | Andrew Retter | 11,167 | 27.2 | -17.7 | |
| Liberal Democrat | Tony Little | 3,049 | 7.4 | -2.9 | |
| Referendum | Frederick Page | 778 | 1.9 | N/A | |
| National Front | John Hutchins | 504 | 1.2 | N/A | |
| All Night Party | Daniel Farrow | 135 | 0.3 | N/A | |
| Majority | 14,291 | 34.8 | |||
| Turnout | 41,091 | 72.3 | -7.4 | ||
| Labour gain from Conservative | Swing | 17.5 | |||
| Party | Candidate | Votes | % | ± | |
|---|---|---|---|---|---|
| Conservative | Terry Dicks | 19,489 | 44.9 | ||
| Labour | John McDonnell | 19,436 | 44.8 | ||
| Liberal Democrat | Tony Little | 4,472 | 10.3 | ||
| Majority | 53 | 0.0 | |||
| Turnout | 43,397 | 79.7 | |||
| Conservative hold | Swing | ||||
Elections in the 1980s
| Party | Candidate | Votes | % | ± | |
|---|---|---|---|---|---|
| Conservative | Terry Dicks | 21,355 | 49.22 | ||
| Labour | Peter Francis Fagan | 15,390 | 35.47 | ||
| Social Democratic | Sue Slipman | 6,641 | 15.31 | ||
| Majority | 5,965 | 13.75 | |||
| Turnout | 74.50 | ||||
| Conservative hold | Swing | ||||
| Party | Candidate | Votes | % | ± | |
|---|---|---|---|---|---|
| Conservative | Terry Dicks | 16,451 | 40.29 | ||
| Labour | Peter Francis Fagan | 12,217 | 29.92 | ||
| Social Democratic | Neville Sandelson | 11,842 | 29.00 | ||
| Freedom | F. Hill | 324 | 0.79 | ||
| Majority | 4,234 | 10.37 | |||
| Turnout | 70.87 | ||||
| Conservative gain from Labour | Swing | ||||
Elections in the 1970s
| Party | Candidate | Votes | % | ± | |
|---|---|---|---|---|---|
| Labour | Neville Sandelson | 20,350 | 48.30 | ||
| Conservative | A. Tyrell | 17,048 | 40.47 | ||
| Liberal | Hester Smallbone | 3,900 | 9.26 | ||
| National Front | G.T. Callow | 582 | 1.38 | ||
| Communist | J. Mansfield | 249 | 0.59 | ||
| Majority | 3,302 | 7,84 | |||
| Turnout | 75.01 | ||||
| Labour hold | Swing | ||||
| Party | Candidate | Votes | % | ± | |
|---|---|---|---|---|---|
| Labour | Neville Sandelson | 20,291 | 52.18 | ||
| Conservative | Neil Roxburgh Balfour | 10,871 | 27.96 | ||
| Liberal | C. Lyon | 6,336 | 16.29 | ||
| National Front | J.S. Fairhurst | 1,189 | 3.06 | ||
| Workers Revolutionary | R. Bull | 198 | 0.51 | ||
| Majority | 9,420 | 24.23 | |||
| Turnout | 69.49 | ||||
| Labour hold | Swing | ||||
| Party | Candidate | Votes | % | ± | |
|---|---|---|---|---|---|
| Labour | Neville Sandelson | 24,682 | 58.71 | ||
| Conservative | P.D. Watherston | 14,634 | 34.81 | ||
| National Front | J.S. Fairhurst | 2,721 | 6.47 | ||
| Majority | 10,048 | 23.09 | |||
| Turnout | 75.81 | ||||
| Labour hold | Swing | ||||
| Party | Candidate | Votes | % | ± | |
|---|---|---|---|---|---|
| Labour | Neville Sandelson | 15,827 | 74.7 | +17.1 | |
| Conservative | Andre Potier | 5,348 | 25.3 | -15.98 | |
| Majority | 10,479 | 49.5 | |||
| Turnout | 21,175 | ||||
| Labour hold | Swing | ||||
| Party | Candidate | Votes | % | ± | |
|---|---|---|---|---|---|
| Labour | Arthur Skeffington | 19,192 | 57.65 | ||
| Conservative | Andre Potier | 13,728 | 41.24 | ||
| Communist | P. Pink | 372 | 1.12 | ||
| Majority | 5,464 | 16.41 | |||
| Turnout | 67.11 | ||||
| Labour hold | Swing | ||||
Elections in the 1960s
| Party | Candidate | Votes | % | ± | |
|---|---|---|---|---|---|
| Labour | Arthur Skeffington | 20,707 | 62.21 | ||
| Conservative | L.E. Smith | 11,883 | 35.70 | ||
| Communist | F. Stanley | 698 | 2.10 | ||
| Majority | 8,824 | 26.51 | |||
| Turnout | 72.69 | ||||
| Labour hold | Swing | ||||
| Party | Candidate | Votes | % | ± | |
|---|---|---|---|---|---|
| Labour | Arthur Skeffington | 20,018 | 58.79 | ||
| Conservative | L.E. Smith | 13,158 | 38.64 | ||
| Communist | F. Stanley | 873 | 2.56 | ||
| Majority | 6,860 | 20.15 | |||
| Turnout | 73.20 | ||||
| Labour hold | Swing | ||||
Elections in the 1950s
| Party | Candidate | Votes | % | ± | |
|---|---|---|---|---|---|
| Labour | Arthur Skeffington | 18,301 | 49.18 | ||
| Conservative | John Anthony Grant | 14,149 | 38.02 | ||
| Liberal | Stanley Gay | 4,235 | 11.38 | ||
| Communist | Francis Foster | 527 | 1.42 | ||
| Majority | 4,152 | 11.16 | |||
| Turnout | 80.47 | ||||
| Labour hold | Swing | ||||
| Party | Candidate | Votes | % | ± | |
|---|---|---|---|---|---|
| Labour | Arthur Skeffington | 19,558 | 57.72 | ||
| Conservative | Anthony Tosswill Courtney | 13,440 | 39.66 | ||
| Communist | Francis Foster | 886 | 2.61 | ||
| Majority | 6,118 | 18.06 | |||
| Turnout | 76.56 | ||||
| Labour hold | Swing | ||||
| Party | Candidate | Votes | % | ± | |
|---|---|---|---|---|---|
| Labour | Arthur Skeffington | 12,797 | |||
| Conservative | Anthony Sumption | 7,221 | |||
| Majority | 5,576 | ||||
| Turnout | |||||
| Labour hold | Swing | ||||
| Party | Candidate | Votes | % | ± | |
|---|---|---|---|---|---|
| Labour | Walter Henry Ayles | 23,823 | 64.79 | ||
| Conservative | M.J. Rantzen | 12,949 | 35.21 | ||
| Majority | 10,874 | 29.57 | |||
| Turnout | 82.20 | ||||
| Labour hold | Swing | ||||
| Party | Candidate | Votes | % | ± | |
|---|---|---|---|---|---|
| Labour | Walter Henry Ayles | 22,490 | 60.14 | ||
| Conservative | C.C. Vinson | 11,218 | 30.00 | ||
| Liberal | John Walter Frank Lett | 3,093 | 8.27 | ||
| Communist | Francis Foster | 593 | 1.59 | ||
| Majority | 11,272 | 30.14 | |||
| Turnout | 85.19 | ||||
| Labour win (new seat) | |||||
See also
Notes and references
- Notes
- ↑ A borough constituency (for the purposes of election expenses and type of returning officer)
- ↑ As with all constituencies, the constituency elects one Member of Parliament (MP) by the first past the post system of election at least every five years.
- ↑ This splinter movement was in part formed from the Labour Conference Vote, adopted by MPs to oppose the Common Market and oppose the keeping of nuclear weapons, at a time when the Cold War was ongoing.
- References
- ↑ "Electorate Figures - Boundary Commission for England". 2011 Electorate Figures. Boundary Commission for England. 4 March 2011. Retrieved 13 March 2011.
- ↑ "Hillingdon Ward population 2011". Neighbourhood Statistics. Office for National Statististics. Retrieved 24 October 2016.
- ↑ Local Authority employment profiles, updated yearly — London Borough of Hillingdon
- ↑ 2001 Census
- ↑ Leigh Rayment's Historical List of MPs – Constituencies beginning with "H" (part 2)
- ↑ "Election Data 2015". Electoral Calculus. Archived from the original on 17 October 2015. Retrieved 17 October 2015.
- ↑ http://www.hillingdon.gov.uk/article/29843/Hayes-and-Harlington-constituency-results-2015 23Jul15
- ↑ http://ukpollingreport.co.uk/2015guide/hayesandharlington/
- ↑ Hayes & Harlington parliamentary constituency BBC
- ↑ "Election Data 2010". Electoral Calculus. Archived from the original on 17 October 2015. Retrieved 17 October 2015.
- ↑ "Election Data 2005". Electoral Calculus. Archived from the original on 15 October 2011. Retrieved 18 October 2015.
- ↑ "Election Data 2001". Electoral Calculus. Archived from the original on 15 October 2011. Retrieved 18 October 2015.
- ↑ "Election Data 1997". Electoral Calculus. Archived from the original on 15 October 2011. Retrieved 18 October 2015.
- ↑ "Election Data 1992". Electoral Calculus. Archived from the original on 15 October 2011. Retrieved 18 October 2015.
- ↑ "Election Data 1987". Electoral Calculus. Archived from the original on 15 October 2011. Retrieved 18 October 2015.
- ↑ "Election Data 1983". Electoral Calculus. Archived from the original on 15 October 2011. Retrieved 18 October 2015.
| Districts |  | |
|---|---|---|
| Attractions |
| |
| Parks and open spaces |
| |
| Constituencies | ||
| Local government | ||
| Tube and rail stations | ||
| Places of worship | ||
| Other topics | ||
| ||
Coordinates: 51°29′35″N 0°26′06″W / 51.493°N 0.435°W