List of Chief Ministers of the Australian Capital Territory by time in office
This is a list of Chief Ministers of the Australian Capital Territory by time in office. The basis of the list is the inclusive number of days between dates.
Rank by time in office
| Rank: | No: | Chief Minister: | Portrait: | Party: | Electorate: | Assumed Office: |
Left Office: |
TERM Time in Office: |
TOTAL Time in Office: | |
|---|---|---|---|---|---|---|---|---|---|---|
| 1. | 5th | Jon Stanhope |  |
Labor | MLA for Ginninderra (1998–2011) |
5 November 2001 | 12 May 2011 | |
9 years, 188 days | |
| 2. | 3rd | Kate Carnell | Liberal | MLA for Molonglo (1992–2000) |
2 March 1995 | 18 October 2000 | |
5 years, 230 days | ||
| 3. | 1st | Rosemary Follett | Labor | MLA for Molonglo (1995–1996) |
11 May 1989 | 5 December 1989 | 208 days | 4 years, 122 days | ||
| 6 June 1991 | 2 March 1995 | 3 years, 330 days | ||||||||
| 4. | 6th | Katy Gallagher | 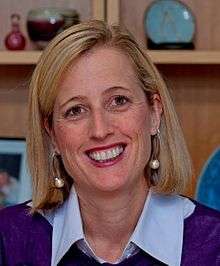 |
Labor | MLA for Molonglo (2001–2014) |
16 May 2011 | 11 December 2014 | |
3 years, 209 days | |
| 5. | 7th | Andrew Barr |  |
Labor | MLA for Molonglo (2006–2016) MLA for Kurrajong (2016- ) |
11 December 2014 | Incumbent | |
1 year, 362 days | |
| 6. | 2nd | Trevor Kaine | Liberal | MLA for Brindabella (1995–2001) |
5 December 1989 | 6 June 1991 | |
1 year, 183 days | ||
| 7. | 4th | Gary Humphries | 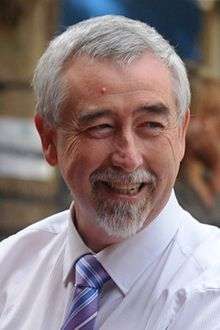 |
Liberal | MLA for Molonglo (1995–2002) |
18 October 2000 | 5 November 2001 | |
1 year, 18 days | |
Total time in office of political parties in Australian Capital Territory
Australian Capital Territory Assembly – 10072 days as of 7 December 2016
Labor
- 7084 days as of 7 December 2016.
Liberal
- 2990 days.
Notes
See also
- Chief Ministers of the Australian Capital Territory
- List of Chief Ministers of the Northern Territory by time in office
This article is issued from Wikipedia - version of the 11/30/2016. The text is available under the Creative Commons Attribution/Share Alike but additional terms may apply for the media files.