List of National Football League attendance figures
The National Football League is the largest live spectator sporting league in the world (excluding auto racing) in terms of average attendance. As of 2015, the NFL averaged 68,400 live spectators per game, and 17,510,312 total for the season.[1]
2015 attendance statistics
| Team | Stadium | Home games | Average attendance | Total attendance | Capacity percentage |
| Green Bay Packers | Lambeau Field | 8 | 78,413 | 627,308 | 107.2%[2] |
| Indianapolis Colts | Lucas Oil Stadium | 8 | 66,047 | 528,381 | 104.8% |
| San Francisco 49ers | Levi's Stadium | 8 | 70,799 | 566,392 | 103.4% |
| Seattle Seahawks | CenturyLink Field | 8 | 69,020 | 552,162 | 103.0% |
| Miami Dolphins | Sun Life Stadium | 8 | 67,193 | 537,548 | 102.9% |
| Philadelphia Eagles | Lincoln Financial Field | 8 | 69,483 | 555,868 | 102.8% |
| Denver Broncos | Sports Authority Field at Mile High | 8 | 76,922 | 615,381 | 101.0% |
| Houston Texans | NRG Stadium | 8 | 71,769 | 574,159 | 101.0% |
| Chicago Bears | Soldier Field | 8 | 62,035 | 496,287 | 100.9% |
| Carolina Panthers | Bank of America Stadium | 8 | 74,056 | 592,454 | 100.4% |
| Baltimore Ravens | M&T Bank Stadium | 8 | 71,002 | 568,018 | 100.0% |
| Minnesota Vikings | TCF Bank Stadium | 8 | 52,430 | 419,440 | 99.8% |
| Atlanta Falcons | Georgia Dome | 8 | 70,355 | 562,845 | 98.8% |
| Arizona Cardinals | University of Phoenix Stadium | 8 | 64,185 | 513,487 | 98.7% |
| Pittsburgh Steelers | Heinz Field | 8 | 64,356 | 514,854 | 98.3% |
| New England Patriots | Gillette Stadium | 8 | 66,829 | 534,632 | 97.2% |
| Kansas City Chiefs | Arrowhead Stadium | 8 | 74,086 | 592,688 | 96.5% |
| New York Giants | MetLife Stadium | 8 | 79,001 | 632,011 | 95.8% |
| Buffalo Bills | Ralph Wilson Stadium | 8 | 69,880 | 559,047 | 95.6% |
| New Orleans Saints | Mercedes-Benz Superdome | 8 | 73,038 | 584,305 | 95.5% |
| New York Jets | MetLife Stadium | 8 | 78,160 | 625,280 | 94.7% |
| San Diego Chargers | Qualcomm Stadium | 8 | 66,772 | 534,180 | 94.6% |
| Detroit Lions | Ford Field | 8 | 61,347 | 490,782 | 94.4% |
| Cincinnati Bengals | Paul Brown Stadium | 8 | 61,389 | 491,118 | 93.7% |
| Tampa Bay Buccaneers | Raymond James Stadium | 8 | 61,560 | 492,480 | 93.5% |
| Dallas Cowboys | AT&T Stadium | 8 | 91,459 | 731,672 | 91.5% |
| Jacksonville Jaguars | EverBank Field | 8 | 61,463 | 430,247 | 91.5% |
| Cleveland Browns | FirstEnergy Stadium | 8 | 66,186 | 529,488 | 90.4% |
| Tennessee Titans | LP Field | 8 | 62,304 | 498,435 | 90.1% |
| Washington Redskins | FedEx Field | 8 | 76,209 | 609,672 | 89.7% |
| Oakland Raiders | O.co Coliseum | 8 | 54,613 | 436,910 | 86.5% |
| St. Louis Rams | Edward Jones Dome | 8 | 52,402 | 419,220 | 80.2% |
2014 attendance statistics
| Team | Stadium | Home Games | Average Attendance | Total Attendance | Capacity Percentage |
| Dallas Cowboys | AT&T Stadium | 8 | 90,069 | 720,558 | 90.1% |
| New York Jets | MetLife Stadium | 8 | 78,160 | 625,280 | 94.7% |
| Green Bay Packers | Lambeau Field | 8 | 78,139 | 625,114 | 106.9%[3] |
| Washington Redskins | FedEx Field | 8 | 77,964 | 623,715 | 91.7% |
| Denver Broncos | Sports Authority Field at Mile High | 8 | 76,939 | 615,517 | 101.1% |
| Kansas City Chiefs | Arrowhead Stadium | 8 | 74,967 | 599,743 | 98.1% |
| Carolina Panthers | Bank of America Stadium | 8 | 73,607 | 588,861 | 99.8% |
| New Orleans Saints | Mercedes-Benz Superdome | 8 | 73,112 | 584,900 | 95.6% |
| Atlanta Falcons | Georgia Dome | 8 | 72,130 | 577,047 | 101.3% |
| Houston Texans | NRG Stadium | 8 | 71,766 | 574,132 | 101.0% |
| Baltimore Ravens | M&T Bank Stadium | 8 | 71,044 | 568,353 | 100.1% |
| San Francisco 49ers | Levi's Stadium | 8 | 70,774 | 566,192 | 103.3% |
| Miami Dolphins | Sun Life Stadium | 8 | 70,035 | 560,280 | 92.7% |
| Philadelphia Eagles | Lincoln Financial Field | 8 | 69,596 | 556,768 | 100.7% |
| Tennessee Titans | LP Field | 8 | 69,143 | 553,144 | 100.5% |
| New England Patriots | Gillette Stadium | 8 | 68,756 | 550,048 | 100.0% |
| Seattle Seahawks | CenturyLink Field | 8 | 68,412 | 547,298 | 102.1% |
| Buffalo Bills | Ralph Wilson Stadium | 8 | 67,522 | 540,180 | 92.4% |
| Cleveland Browns | FirstEnergy Stadium | 8 | 67,425 | 539,400 | 92.1% |
| Jacksonville Jaguars | EverBank Field | 8 | 65,541 | 524,335 | 97.5% |
| San Diego Chargers | Qualcomm Stadium | 8 | 65,432 | 523,457 | 93.5% |
| Indianapolis Colts | Lucas Oil Stadium | 8 | 65,375 | 523,004 | 103.8% |
| Detroit Lions | Ford Field | 8 | 63,024 | 504,198 | 97.0% |
| Pittsburgh Steelers | Heinz Field | 8 | 62,226 | 497,811 | 95.0% |
| Arizona Cardinals | University of Phoenix Stadium | 8 | 61,979 | 495,835 | 95.4% |
| Chicago Bears | Soldier Field | 8 | 61,681 | 493,449 | 100.3% |
| Cincinnati Bengals | Paul Brown Stadium | 8 | 60,703 | 485,628 | 92.7% |
| Tampa Bay Buccaneers | Raymond James Stadium | 8 | 59,659 | 477,273 | 90.6% |
| St. Louis Rams | Edward Jones Dome | 8 | 57,018 | 456,146 | 86.4% |
| Oakland Raiders | O.co Coliseum | 7 | 53,699 | 375,683 | 84.9% |
| Minnesota Vikings | TCF Bank Stadium | 8 | 52,238 | 417,906 | 99.5% |
2013 attendance statistics
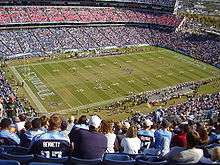
LP Field
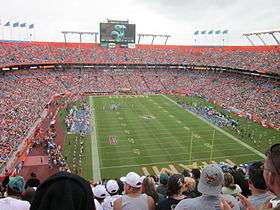
Sun Life Stadium
| Team | Stadium | Home Games | Average Attendance | Total Attendance | Capacity Percentage |
| Dallas Cowboys | Cowboys Stadium | 8 | 88,043 | 704,345 | 110.1%[4] |
| New York Giants | MetLife Stadium | 8 | 80,148 | 641,184 | 97.1% |
| Green Bay Packers | Lambeau Field | 8 | 77,947 | 623,577 | 106.9% |
| Washington Redskins | FedExField | 8 | 77,220 | 617,767 | 84.2% |
| New York Jets | MetLife Stadium | 8 | 76,957 | 615,656 | 93.3% |
| Denver Broncos | Sports Authority Field at Mile High | 8 | 76,872 | 614,977 | 101.0% |
| Kansas City Chiefs | Arrowhead Stadium | 8 | 75,359 | 602,877 | 98.2% |
| Carolina Panthers | Bank of America Stadium | 8 | 73,443 | 587,544 | 99.5% |
| New Orleans Saints | Mercedes-Benz Superdome | 8 | 72,901 | 583,210 | 99.9% |
| Houston Texans | Reliant Stadium | 8 | 71,658 | 573,271 | 100.9% |
| Cleveland Browns | Cleveland Browns Stadium | 8 | 71,242 | 569,939 | 97.3% |
| Baltimore Ravens | M&T Bank Stadium | 8 | 71,135 | 569,084 | 100.2% |
| Atlanta Falcons | Georgia Dome | 8 | 70,224 | 561,795 | 98.6% |
| San Francisco 49ers | Candlestick Park | 8 | 69,732 | 557,856 | 99.3% |
| Philadelphia Eagles | Lincoln Financial Field | 8 | 69,144 | 553,152 | 102.3% |
| Tennessee Titans | LP Field | 8 | 69,143 | 553,144 | 100.0% |
| New England Patriots | Gillette Stadium | 8 | 68,756 | 550,048 | 100.0% |
| Seattle Seahawks | CenturyLink Field | 8 | 68,197 | 545,577 | 101.8% |
| Buffalo Bills | Ralph Wilson Stadium | 7 | 66,267 | 463,873 | 90.7% |
| Indianapolis Colts | Lucas Oil Stadium | 8 | 65,950 | 527,606 | 104.7% |
| Miami Dolphins | Sun Life Stadium | 8 | 64,319 | 514,553 | 85.5% |
| San Diego Chargers | Qualcomm Stadium | 8 | 64,205 | 513,641 | 90.1% |
| Minnesota Vikings | Hubert H. Humphrey Metrodome | 7 | 64,019 | 448,135 | 99.8% |
| Detroit Lions | Ford Field | 8 | 63,796 | 510,369 | 98.9% |
| Cincinnati Bengals | Paul Brown Stadium | 8 | 63,297 | 506,377 | 96.6% |
| Chicago Bears | Soldier Field | 8 | 62,358 | 498,864 | 101.4% |
| Arizona Cardinals | University of Phoenix Stadium | 8 | 61,033 | 488,271 | 96.3% |
| Jacksonville Jaguars | EverBank Field | 7 | 59,940 | 419,581 | 89.2% |
| Tampa Bay Buccaneers | Raymond James Stadium | 8 | 58,818 | 470,548 | 89.6% |
| Pittsburgh Steelers | Heinz Field | 8 | 57,311 | 458,489 | 88.2% |
| St. Louis Rams | Edward Jones Dome | 8 | 56,957 | 455,657 | 87.2% |
| Oakland Raiders | O.co Coliseum | 8 | 50,444 | 403,556 | 80.0% |
2013 notes
2012 attendance statistics
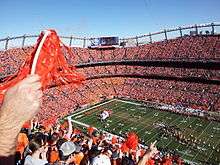
Sports Authority Field at Mile High
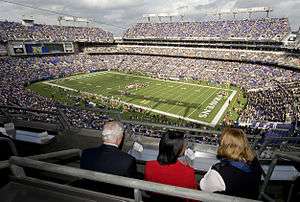
M&T Bank Stadium
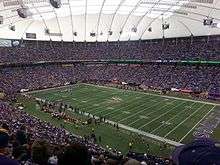
Hubert H. Humphrey Metrodome
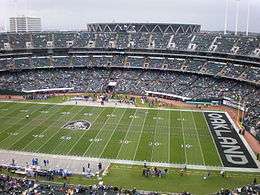
O.co Coliseum
| Team | Stadium | Home Games | Average Attendance | Total Attendance | Capacity Percentage |
| Dallas Cowboys | Cowboys Stadium | 8 | 88,531 | 708,249 | 110.7%[5] |
| New York Giants | MetLife Stadium | 8 | 80,495 | 643,964 | 97.6% |
| Washington Redskins | FedExField | 8 | 79,654 | 637,236 | 96.9% |
| New York Jets | MetLife Stadium | 8 | 79,088 | 632,704 | 95.9% |
| Denver Broncos | Sports Authority Field at Mile High | 8 | 76,632 | 613,062 | 100.7% |
| Carolina Panthers | Bank of America Stadium | 8 | 73,293 | 586,347 | 99.3% |
| New Orleans Saints | Mercedes-Benz Superdome | 8 | 72,888 | 583,107 | 99.9% |
| Houston Texans | Reliant Stadium | 8 | 71,665 | 573,321 | 100.9% |
| Baltimore Ravens | M&T Bank Stadium | 8 | 71,278 | 570,229 | 100.4% |
| Green Bay Packers | Lambeau Field | 8 | 70,507 | 564,062 | 96.7% |
| Atlanta Falcons | Georgia Dome | 8 | 70,096 | 560,773 | 98.4% |
| San Francisco 49ers | Candlestick Park | 8 | 69,732 | 557,856 | 99.3% |
| Philadelphia Eagles | Lincoln Financial Field | 8 | 69,144 | 553,152 | 102.3% |
| Tennessee Titans | LP Field | 8 | 69,143 | 553,144 | 100.0% |
| New England Patriots | Gillette Stadium | 8 | 68,755 | 550,044 | 100.0% |
| Kansas City Chiefs | Arrowhead Stadium | 8 | 68,508 | 548,070 | 89.3% |
| Seattle Seahawks | CenturyLink Field | 8 | 67,446 | 543,570 | 101.4% |
| Cleveland Browns | Cleveland Browns Stadium | 8 | 66,632 | 533,058 | 91.0% |
| Indianapolis Colts | Lucas Oil Stadium | 8 | 65,189 | 521,518 | 103.5% |
| Jacksonville Jaguars | EverBank Field | 8 | 64,984 | 519,872 | 96.8% |
| Buffalo Bills | Ralph Wilson Stadium** | 7 | 64,850 | 454,653 | 88.9% |
| Detroit Lions | Ford Field | 8 | 63,769 | 510,158 | 98.9% |
| Chicago Bears | Soldier Field | 8 | 62,329 | 498,633 | 101.3% |
| Cincinnati Bengals | Paul Brown Stadium | 8 | 61,188 | 489,504 | 93.4% |
| Pittsburgh Steelers | Heinz Field | 8 | 61,141 | 489,135 | 94.1% |
| Arizona Cardinals | University of Phoenix Stadium | 8 | 60,890 | 487,125 | 96.0% |
| Minnesota Vikings | Hubert H. Humphrey Metrodome | 8 | 60,725 | 485,802 | 94.7% |
| San Diego Chargers | Qualcomm Stadium | 8 | 59,964 | 479,716 | 84.1% |
| Miami Dolphins | Sun Life Stadium | 8 | 57,379 | 459,033 | 76.3% |
| St. Louis Rams | Edward Jones Dome | 7 | 56,703 | 396,925 | 86.8% |
| Tampa Bay Buccaneers | Raymond James Stadium | 8 | 55,102 | 440,189 | 83.9% |
| Oakland Raiders | O.co Coliseum | 8 | 54,216 | 433,732 | 86.0% |
2012 notes
2011 attendance statistics

Reliant Stadium
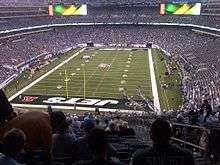
New Meadowlands Stadium
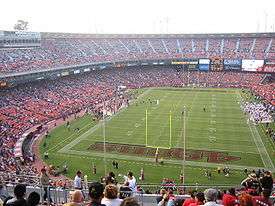
Candlestick Park
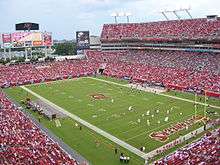
Raymond James Stadium
| Team | Stadium | Home Games | Average Attendance | Total Attendance | Capacity Percentage |
| Dallas Cowboys | Cowboys Stadium | 8 | 85,512 | 684,096 | 106.9%[6] |
| New York Giants | New Meadowlands Stadium | 8 | 79,475 | 635,800 | 96.3% |
| New York Jets | New Meadowlands Stadium | 8 | 78,986 | 631,888 | 95.7% |
| Washington Redskins | FedExField | 8 | 76,921 | 615,368 | 83.9% |
| Denver Broncos | Invesco Field at Mile High | 8 | 75,327 | 602,618 | 99.0% |
| New Orleans Saints | Mercedes-Benz Superdome | 8 | 73,042 | 584,336 | 100.1% |
| Carolina Panthers | Bank of America Stadium | 8 | 72,292 | 578,342 | 98.0% |
| Kansas City Chiefs | Arrowhead Stadium | 8 | 72,082 | 576,659 | 93.9% |
| Houston Texans | Reliant Stadium | 8 | 71,496 | 571,969 | 100.6% |
| Baltimore Ravens | M&T Bank Stadium | 8 | 71,224 | 569,792 | 100.3% |
| Green Bay Packers | Lambeau Field | 8 | 70,512 | 564,097 | 96.7% |
| San Francisco 49ers | Candlestick Park | 8 | 69,732 | 557,856 | 99.3% |
| Philadelphia Eagles | Lincoln Financial Field | 8 | 69,144 | 553,152 | 102.3% |
| Tennessee Titans | LP Field | 8 | 69,143 | 553,144 | 100.0% |
| Atlanta Falcons | Georgia Dome | 8 | 68,986 | 551,892 | 96.8% |
| New England Patriots | Gillette Stadium | 8 | 68,756 | 550,048 | 100.0% |
| Seattle Seahawks | CenturyLink Field | 8 | 66,413 | 531,311 | 99.1% |
| Cleveland Browns | Cleveland Browns Stadium | 8 | 65,859 | 526,874 | 90.0% |
| San Diego Chargers | Qualcomm Stadium | 8 | 65,392 | 523,143 | 91.7% |
| Indianapolis Colts | Lucas Oil Stadium | 8 | 64,828 | 518,627 | 102.9% |
| Detroit Lions | Ford Field | 8 | 63,742 | 509,940 | 98.8% |
| Pittsburgh Steelers | Heinz Field | 8 | 63,034 | 504,279 | 97.0% |
| Minnesota Vikings | Hubert H. Humphrey Metrodome | 8 | 62,816 | 502,529 | 98.0% |
| Jacksonville Jaguars | EverBank Field | 8 | 62,331 | 498,655 | 92.8% |
| Chicago Bears | Soldier Field | 8 | 62,145 | 497,166 | 101.0% |
| Arizona Cardinals | University of Phoenix Stadium | 8 | 61,181 | 489,455 | 96.5% |
| Miami Dolphins | Sun Life Stadium | 8 | 60,886 | 487,089 | 81.0% |
| Oakland Raiders | Oakland–Alameda County Coliseum | 8 | 59,242 | 473,938 | 94.0% |
| St. Louis Rams | Edward Jones Dome | 8 | 56,394 | 451,153 | 86.3% |
| Buffalo Bills | Ralph Wilson Stadium** | 7 | 62,694 | 438,864 | 85.8% |
| Tampa Bay Buccaneers | Raymond James Stadium* | 7 | 56,614 | 396,300 | 86.2% |
| Cincinnati Bengals | Paul Brown Stadium | 8 | 49,251 | 394,009 | 75.2% |
2011 notes
2010 attendance statistics
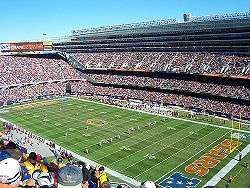
Soldier Field
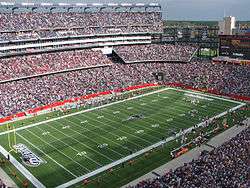
Gillette Stadium
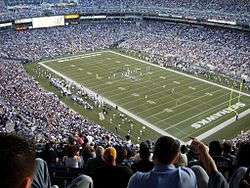
Qwest Field

Cleveland Browns Stadium
| Team | Stadium | Home Games | Average Attendance | Total Attendance | Capacity Percentage |
| Dallas Cowboys | Cowboys Stadium | 8 | 87,047 | 696,377 | 108.8%[7] |
| Washington Redskins | FedExField | 8 | 83,172 | 665,380 | 90.7% |
| New York Giants | New Meadowlands Stadium | 8 | 79,019 | 632,156 | 95.8% |
| New York Jets | New Meadowlands Stadium | 8 | 78,596 | 628,768 | 95.3% |
| Denver Broncos | Invesco Field at Mile High | 8 | 74,908 | 599,264 | 98.4% |
| Carolina Panthers | Bank of America Stadium | 8 | 72,620 | 580,965 | 98.4% |
| Baltimore Ravens | M&T Bank Stadium | 8 | 71,227 | 569,817 | 100.3% |
| Houston Texans | Reliant Stadium | 8 | 71,080 | 568,643 | 100.0% |
| Green Bay Packers | Lambeau Field | 8 | 70,795 | 566,362 | 97.1% |
| New Orleans Saints | Louisiana Superdome | 8 | 70,038 | 560,304 | 96.0% |
| Philadelphia Eagles | Lincoln Financial Field | 8 | 69,144 | 553,152 | 102.3% |
| Tennessee Titans | LP Field | 8 | 69,143 | 553,144 | 100.0% |
| New England Patriots | Gillette Stadium | 8 | 68,756 | 550,048 | 100.0% |
| Atlanta Falcons | Georgia Dome | 8 | 67,850 | 542,800 | 95.2% |
| Miami Dolphins | Sun Life Stadium | 8 | 67,744 | 541,959 | 90.1% |
| Kansas City Chiefs | Arrowhead Stadium | 8 | 67,672 | 541,380 | 88.2% |
| Seattle Seahawks | Qwest Field | 8 | 66,992 | 539,141 | 100.0% |
| Indianapolis Colts | Lucas Oil Stadium | 8 | 66,975 | 535,942 | 106.3% |
| Cleveland Browns | Cleveland Browns Stadium | 8 | 66,116 | 528,933 | 90.3% |
| San Diego Chargers | Qualcomm Stadium | 8 | 65,530 | 524,241 | 91.9% |
| Pittsburgh Steelers | Heinz Field | 8 | 63,083 | 504,669 | 97.1% |
| Jacksonville Jaguars | EverBank Field | 8 | 63,032 | 504,262 | 93.8% |
| Arizona Cardinals | University of Phoenix Stadium | 8 | 62,774 | 502,197 | 99.0% |
| Chicago Bears | Soldier Field | 8 | 62,195 | 497,561 | 101.1% |
| San Francisco 49ers | Candlestick Park | 7 | 69,732 | 488,124 | 99.3% |
| Cincinnati Bengals | Paul Brown Stadium | 8 | 60,364 | 482,917 | 92.1% |
| Minnesota Vikings | Hubert H. Humphrey Metrodome** | 8 | 58,751 | 470,009 | 94.1% |
| Detroit Lions | Ford Field | 8 | 56,285 | 450,286 | 87.3% |
| Buffalo Bills | Ralph Wilson Stadium** | 7 | 63,195 | 442,366 | 86.5% |
| St. Louis Rams | Edward Jones Dome | 8 | 52,922 | 423,383 | 81.0% |
| Tampa Bay Buccaneers | Raymond James Stadium | 8 | 49,314 | 394,513 | 75.1% |
| Oakland Raiders | Oakland–Alameda County Coliseum | 8 | 46,431 | 371,448 | 73.7% |
2010 notes
See also
References
|
|---|
|
|
|
| By sports | |
|---|
|
| By country | |
|---|
|
| By year | |
|---|


