List of countries by beer consumption per capita
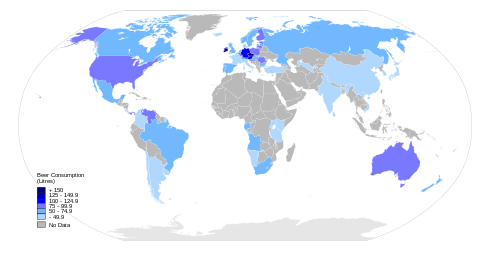
Beer consumption per capita by country (2009). Measurements are shown in litres.
This is a list of countries ordered by annual per capita consumption of beer.
| Rank | Country | Consumption per capita [1] (litres) |
2013–2014 change (633–ml bottles) |
Total national consumption (106 L)[A] |
Year |
|---|---|---|---|---|---|
| 1 | | 142.6 | -7.3 | 1879 | 2014 |
| 2 | | 114.6 | 7.8 | 11 | 2014 |
| 3 | | 104.8 | -1.7 | 894 | 2014 |
| 4 | | 104.7 | 4.4 | 8441 | 2014 |
| 5 | | 104 | -7.2 | 250 | 2014 |
| 6 | | 97.8 | 0.1 | 3776 | 2014 |
| 7 | | 97 | -0.5 | 454 | 2014 |
| 8 | | 96.6 | 10.7 | 282 | 2014 |
| 9 | | 93.8 | -8.8 | 33 | 2014 |
| 10 | | 93.5 | -5 | 123 | 2014 |
| 11 | | 88.9 | 22.3 | 150 | 2014 |
| 12 | | 85.9 | 8.3 | 1689 | 2014 |
| 13 | | 80.6 | 5.9 | 3729 | 2014 |
| 14 | | 78.5 | -2.7 | 430 | 2014 |
| 15 | | 78.2 | 4.6 | 156 | 2014 |
| 16 | | 76.6 | 5.1 | 296 | 2014 |
| 17 | | 75.8 | -0.3 | 24172 | 2014 |
| 18 | | 75 | 0.8 | 155 | 2014 |
| 19 | | 74.2 | -0.9 | 1753 | 2014 |
| 20 | | 74.1 | 0.3 | 402 | 2014 |
| 21 | | 72.5 | -3.9 | 309 | 2014 |
| 22 | | 72 | 0 | 810 | 2014 |
| 23 | | 71.4 | 2.6 | 1205 | 2014 |
| 24 | | 70.8 | 1.2 | 2173 | 2014 |
| 25 | | 69.8 | -5.1 | 503 | 2014 |
| 26 | | 68.9 | 10062 | 2014 | |
| 27 | | 68.3 | 5.2 | 13146 | 2014 |
| 28 | | 67.7 | 2.4 | 4375 | 2014 |
| 29 | | 66.6 | -1.3 | 300 | 2014 |
| 30 | | 64.2 | 1160 | 2012 | |
| 31 | | 63.3 | 1.9 | 626 | 2014 |
| 32 | | 62.7 | -2 | 282 | 2014 |
| 33 | | 62.1 | -7.2 | 39 | 2014 |
| 34 | | 61.9 | 1.9 | 350 | 2014 |
| 35 | | 61.8 | 46.6 | 137 | 2014 |
| 36 | | 61.8 | 1.9 | 20 | 2014 |
| 37 | | 61.6 | 2760 | 2012 | |
| 38 | | 60.3 | 43.2 | 2013 | |
| 39 | | 60.3 | 212.0 | 2013 | |
| 40 | | 59.9 | 6890 | 2012 | |
| 41 | | 58.4 | -2 | 3150 | 2014 |
| 42 | | 58.3 | 460 | 2012 | |
| 43 | | 56.1 | 220 | 2012 | |
| 44 | | 52.7 | 480 | 2012 | |
| 45 | | 49 | 1980 | ||
| 46 | | 45.8 | 6.5 | 2292 | 2014 |
| 47 | | 42.6 | -0.8 | 5407 | 2014 |
| 48 | | 32 | 44683 | 2012 | |
| 49 | | 29 | 1772 | 2011 | |
| 50 | | 19 | |||
| 51 | | 14 | |||
| 52 | | 13 | |||
| 53 | | 12 | |||
| 54 | | 11 | |||
| 55 | | 8 | |||
| 56 | | 6 | |||
| 57 | | 2 | 50 | ||
| 58 | | 2 | 1400 | 2008 |
See also
- List of countries by alcohol consumption
- List of beer production by region/by country http://www.kirinholdings.co.jp/english/news/2012/0808_01.html#table2
Notes
- ^ Combination of per capita rates with respective populations at time of study. Data taken verbatim from the Kirin report.
References
- ↑ Source, unless otherwise noted: Per Capita Beer Consumption by Country in 2014, Kirin Holdings Company. Table 3.
- 1 2 3 4 5 6 7 Per Capita Beer Consumption by Country in 2012, Kirin Holdings Company. Table 3.
- 1 2 Per Capita Beer Consumption by Country in 2013, Kirin Holdings Company. Table 3.
- ↑ sectoresonline.com (September 2, 2011). "Una mala para el sector vitivinícola: en Argentina se consume más cerveza que vino". Andino (in Spanish). Retrieved September 2, 2011.
- ↑ "AssoBirra annual report 2011" (PDF). Retrieved June 4, 2013.
- ↑ "Danish brewer Carlsberg buys stake in Vietnam brewer". EarthTimes. DPA. April 23, 2008. Retrieved October 13, 2010.
- ↑ http://www.calcalist.co.il/consumer/articles/0,7340,L-3591948,00.html
- ↑ "Kriz geldi, alkol tüketimi yüzde 20 arttı". NTVMSNBC. NTV. 2008.
- 1 2 3 Barigaba, Julius (August 17, 2009). "Uganda brewers toast to higher sales, thanks to low-end products". EastAfrican. Retrieved October 13, 2010.
- ↑ "Heineken Partners with Efes Breweries in Uzbekistan, Serbia and Kazakhstan". FlexNews. January 1, 2008. Retrieved October 13, 2010.
- ↑ "Lion seeks to reduce gearing through Rs. 1.2 bn. cash infusion". Sunday Island. August 16, 2009. Retrieved October 13, 2010.
- ↑ "http://www.financialexpress.com/news/new-pact-lets-ub-sell-heineken-in-india/551227/0". The Financial Express. December 8, 2009. Retrieved October 13, 2010. External link in
|title=(help) - ↑ Chandran, Rina (June 22, 2009). "Super cars, premium beers help rich Indians beat blues". Reuters. Retrieved October 13, 2010.
| Africa |  | |
|---|---|---|
| Asia | ||
| Europe | ||
| North America | ||
| Oceania | ||
| South America | ||
This article is issued from Wikipedia - version of the 11/27/2016. The text is available under the Creative Commons Attribution/Share Alike but additional terms may apply for the media files.