Material selection
Material selection is a step in the process of designing any physical object. In the context of product design, the main goal of material selection is to minimize cost while meeting product performance goals.[1] Systematic selection of the best material for a given application begins with properties and costs of candidate materials. For example, a thermal blanket must have poor thermal conductivity in order to minimize heat transfer for a given temperature difference.
Systematic selection for applications requiring multiple criteria is more complex. For example, a rod which should be stiff and light requires a material with high Young's modulus and low density. If the rod will be pulled in tension, the specific modulus, or modulus divided by density , will determine the best material. But because a plate's bending stiffness scales as its thickness cubed, the best material for a stiff and light plate is determined by the cube root of stiffness divided by density . For a stiff beam in bending the material index is .

![{\sqrt[ {3}]{E}}/\rho](../I/m/5c59e1821d68e3209f3e80363bf7cb0aa9a67aa2.svg)
![{\sqrt[ {2}]{E}}/\rho](../I/m/405953ee2761b552e70a0498ca72e95e0d5a84a2.svg)
Ashby plots

An Ashby plot, named for Michael Ashby of Cambridge University, is a scatter plot which displays two or more properties of many materials or classes of materials.[2] These plots are useful to compare the ratio between different properties. For the example of the stiff/light part discussed above would have Young's modulus on one axis and density on the other axis, with one data point on the graph for each candidate material. On such a plot, it is easy to find not only the material with the highest stiffness, or that with the lowest density, but that with the best ratio . Using a log scale on both axes facilitates selection of the material with the best plate stiffness .

The first plot on the right shows density and Young's modulus, in a linear scale. The second plot shows the same materials attributes in a log-log scale. Materials families (polymers, foams, metals, etc.) are identified by colors.[3]
Thus as energy prices have increased and technology has improved, automobiles have substituted increasing amounts of lightweight magnesium and aluminium alloys for steel, aircraft are substituting carbon fiber reinforced plastic and titanium alloys for aluminium, and satellites have long been made out of exotic composite materials.
Of course, cost per kg is not the only important factor in material selection. An important concept is 'cost per unit of function'. For example, if the key design objective was the stiffness of a plate of the material, as described in the introductory paragraph above, then the designer would need a material with the optimal combination of density, Young's modulus, and price. Optimizing complex combinations of technical and price properties is a hard process to achieve manually, so rational material selection software is an important tool.
General method for using an Ashby chart
Utilizing an "Ashby chart" is a common method for choosing the appropriate material. First, three different sets of variables are identified:
- Material variables are the inherent properties of a material such as density, modulus, yield stress, and many others.
- Free variables are quantities that can change during the loading cycle, for example, applied force.
- Design variables are limits imposed on the design, such as how thick the beam can be or how much it can deflect
Next, an equation for the performance index is derived. This equation numerically quantifies how desirable the material will be for a specific situation. By convention, a higher performance index denotes a better material. Lastly, the performance index is plotted on the Ashby chart. Visual inspection reveals the most desirable material.
Example of using an Ashby chart
In this example, the material will be subject to both tension and bending. Therefore, the optimal material will perform well under both circumstances.
Performance index during tension
In the first situation the beam experiences two forces: the weight of gravity and tension . The material variables are density and strength . Assume that the length and tension are fixed, making them design variables. Lastly the cross sectional area is a free variable. The objective in this situation is to minimize the weight by choosing a material with the best combination of material variables . Figure 1 illustrates this loading.


The stress in the beam is measured as whereas weight is described by . Deriving a performance index requires that all free variables are removed, leaving only design variables and material variables. In this case that means that must be removed. The axial stress equation can be rearranged to give . Substituting this into the weight equation gives . Next, the material variables and design variables are grouped separately, giving .


Since both and are fixed, and since the goal is to minimize , then the ratio should be minimized. By convention, however, the performance index is always a quantity which should be maximized. Therefore, the resulting equation is


Performance index during bending
Next, suppose that the material is also subjected to bending forces. The max tensile stress equation of bending is , where is the bending moment, is the distance from the neutral axis, and is the moment of inertia. This is shown in Figure 2. Using the weight equation above and solving for the free variables, the solution arrived at is , where is the length and is the height of the beam. Assuming that , , and are fixed design variables, the performance index for bending becomes .


Selecting the best material overall
At this point two performance indices that have been derived: for tension and for bending . The first step is to create a log-log plot and add all known materials in the appropriate locations. However, the performance index equations must be modified before being plotted on the log-log graph.


For the tension performance equation , the first step is to take the log of both sides. The resulting equation can be rearranged to give . Note that this follows the format of , making it linear on a log-log graph. Similarly, the y-intercept is the log of . Thus, the fixed value of for tension in Figure 3 is 0.1.


The bending performance equation can be treated similarly. Using the power property of logarithms it can be derived that . The value for for bending is ≈ 0.0316 in Figure 3. Finally, both lines are plotted on the Ashby chart.

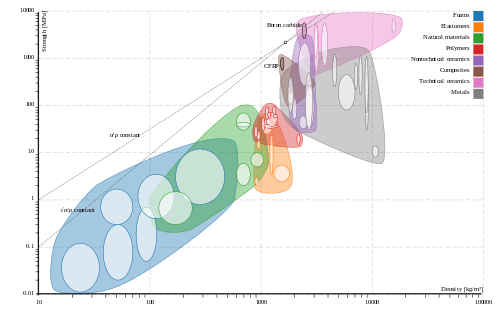
First, the best bending materials can be found by examining which regions are higher on the graph than the bending line. In this case, some of the foams (blue) and technical ceramics (pink) are higher than the line. Therefore those would be the best bending materials. In contrast, materials which are far below the line (like metals in the bottom-right of the gray region) would be the worst materials.
Lastly, the tension line can be used to "break the tie" between foams and technical ceramics. Since technical ceramics are the only material which is located higher than the tension line, then the best-performing tension materials are technical ceramics. Therefore, the overall best material is a technical ceramics in the top-left of the pink region such as boron carbide.
Numerically understanding the chart
The performance index can then be plotted on the Ashby chart by converting the equation to a log scale. This is done by taking the log of both sides, and plotting it similar to a line with being the y-axis intercept. This means that the higher the intercept, the higher the performance of the material. By moving the line up the Ashby chart, the performance index gets higher. Each materials the line passes through, has the performance index listed on the y-axis. So, moving to the top of the chart while still touching a region of material is where the highest performance will be.

As seen from figure 3 the two lines intercept near the top of the graph at Technical ceramics and Composites. This will give a performance index of 120 for tensile loading and 15 for bending. When taking into consideration the cost of the engineering ceramics, especially because the intercept is around the Boron carbide, this would not be the optimal case. A better case with lower performance index but more cost effective solutions is around the Engineering Composites near CFRP.
References
- ↑ George E. Dieter (1997). "Overview of the Materials Selection Process", ASM Handbook Volume 20: Materials Selection and Design.
- ↑ Ashby, Michael (1999). Materials Selection in Mechanical Design (3rd ed.). Burlington, Massachusetts: Butterworth-Heinemann. ISBN 0-7506-4357-9.
- ↑ Ashby, Michael F. (2005). Materials Selection in Mechanical Design. USA: Elsevier Ltd. p. 251. ISBN 978-0-7506-6168-3.