Mathematical visualization
Mathematical visualization is an aspect of geometry which allows one to understand and explore mathematical phenomena via visualization. Classically this consisted of two-dimensional drawings or building three-dimensional models (particularly plaster models in the 19th and early 20th century), while today it most frequently consists of using computers to make static two or three dimensional drawings, animations, or interactive programs. Writing programs to visualize mathematics is an aspect of computational geometry.
Applications
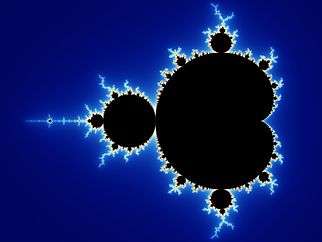
Mathematical visualization is used throughout mathematics, particularly in the fields of geometry and analysis. Notable examples include plane curves, space curves, polyhedra, ordinary differential equations, partial differential equations (particularly numerical solutions, as in fluid dynamics or minimal surfaces such as soap films), conformal maps, fractals, and chaos.
Examples
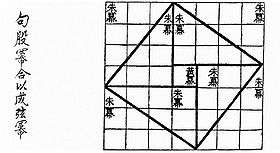
- Proofs without words have existed since antiquity, as in the Pythagorean theorem proof found in the Zhou Bi Suan Jing Chinese text which dates from 1046 BC to 256 BC.
- The Clebsch diagonal surface demonstrates the 27 lines on a cubic surface.

- Sphere eversion – that a sphere can be turned inside out in 3 dimension if allowed to pass through itself, but without kinks – was a startling and counter-intuitive result, originally proven via abstract means, later demonstrated graphically, first in drawings, later in computer animation.
The cover of the journal The Notices of the American Mathematical Society regularly features a mathematical visualization.
Software
See also
References
- Palais, Richard S. (June–July 1999), "The Visualization of Mathematics: Towards a Mathematical Exploratorium" (PDF), Notices of the American Mathematical Society, 46 (6): 647–658