Metal L-edge

Metal L-edge spectroscopy is a spectroscopic technique used to study the electronic structures of transition metal atoms and complexes. This method measures X-ray absorption caused by the excitation of a metal 2p electron to unfilled d orbitals (e.g. 3d for first-row transition metals), which creates a characteristic absorption peak called the L-edge. According to the selection rules, the transition is formally electric-dipole allowed, which not only makes it more intense than an electric-dipole forbidden metal K pre-edge (1s → 3d) transition,[1] but also makes it more feature-rich as the lower required energy (~400-1000 eV from scandium to copper) results in a higher-resolution experiment.[2]
In the simplest case, that of a cupric (CuII) complex, the 2p → 3d transition produces a 2p53d10 final state. The 2p5 core hole created in the transition has an orbital angular momentum L=1 which then couples to the spin angular momentum S=1/2 to produce J=3/2 and J=1/2 final states. These states are directly observable in the L-edge spectrum as the two main peaks (Figure 1). The peak at lower energy (~930 eV) has the greatest intensity and is called the L3-edge, while the peak at higher energy (~950 eV) has less intensity and is called the L2-edge.
Spectral components

As we move left across the periodic table (e.g. from copper to iron), we create additional holes in the metal 3d orbitals. For example, a low-spin ferric (FeIII) system in an octahedral environment has a ground state of (t2g)5(eg)0 resulting in transitions to the t2g (dπ) and eg (dσ) sets. Therefore, there are two possible final states: t2g6eg0 or t2g5eg1(Figure 2a). Since the ground-state metal configuration has four holes in the eg orbital set and one hole in the t2g orbital set, an intensity ratio of 4:1 might be expected (Figure 2b). However, this model does not take into account covalent bonding and, indeed, an intensity ratio of 4:1 is not observed in the spectrum.
In the case of iron, the d6 excited state will further split in energy due to d-d electron repulsion (Figure 2c). This splitting is given by the right-hand (high-field) side of the d6 Tanabe-Sugano diagram and can be mapped onto a theoretical simulation of a L-edge spectrum (Figure 2d). Other factors such as p-d electron repulsion and spin-orbit coupling of the 2p and 3d electrons must also be considered to fully simulate the data.
For a ferric system, all of these effects result in 252 initial states and 1260 possible final states that together will comprise the final L-edge spectrum (Figure 2e). Despite all of these possible states, it has been established that in a low-spin ferric system, the lowest energy peak is due to a transition to the t2g hole and the more intense and higher energy (~3.5 eV) peak is to that of the unoccupied eg orbitals.[3]
Feature mixing
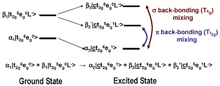
In most systems, bonding between a ligand and a metal atom can be thought of in terms of metal-ligand covalent bond where the occupied ligand orbitals donates some electron density to the metal. This is commonly known as ligand-to-metal charge transfer or LMCT. In some cases, low-lying unoccupied ligand orbitals (π*) can receive back-donation (or backbonding) from the occupied metal orbitals. This has the opposite effect on the system, resulting in metal-to-ligand charge transfer, MLCT, and commonly appears as an additional L-edge spectral feature.
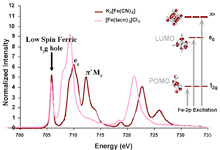
An example of this feature occurs in low-spin ferric [Fe(CN)6]3−, since CN− is a ligand that can have backbonding. While backbonding is important in the initial state, it would only warrant a small feature in the L-edge spectrum. In fact, it is in the final state where the backbonding π* orbitals are allowed to mix with the very intense eg transition, thus borrowing intensity and resulting in the final dramatic three peak spectrum (Figure 3 and Figure 4).[4]
Model construction
X-ray absorption spectroscopy (XAS), like other spectroscopies, looks at the excited state to infer information about the ground state. To make a quantitative assignment, L-edge data is fitted using a valence bond configuration interaction (VBCI) model where LMCT and MLCT are applied as needed to successfully simulate the observed spectral features.[3] These simulations are then further compared to density functional theory (DFT) calculations to arrive at a final interpretation of the data and an accurate description of the electronic structure of the complex (Figure 4).
In the case of iron L-edge, the excited state mixing of the metal eg orbitals into the ligand π* make this method a direct and very sensitive probe of backbonding.[4]
See also
References
- ↑ Westre, Tami E.; Kennepohl, Pierre; DeWitt, Jane G.; Hedman, Britt; Hodgson, Keith O.; Solomon, Edward I. (July 1997). "A Multiplet Analysis of Fe K-Edge 1s → 3d Pre-Edge Features of Iron Complexes". Journal of the American Chemical Society. 119 (27): 6297–6314. doi:10.1021/ja964352a.
- ↑ Cramer, S. P.; DeGroot, F. M. F.; Ma, Y.; Chen, C. T.; Sette, F.; Kipke, C. A.; Eichhorn, D. M.; Chan, M. K.; Armstrong, W. H. (October 1991). "Ligand field strengths and oxidation states from manganese L-edge spectroscopy". Journal of the American Chemical Society. 113 (21): 7937–7940. doi:10.1021/ja00021a018.
- 1 2 Wasinger, Erik C.; de Groot, Frank M. F.; Hedman, Britt; Hodgson, Keith O.; Solomon, Edward I. (October 2003). "L-edge X-ray Absorption Spectroscopy of Non-Heme Iron Sites: Experimental Determination of Differential Orbital Covalency". Journal of the American Chemical Society. 125 (42): 12894–12906. doi:10.1021/ja034634s.
- 1 2 Hocking, Rosalie K.; Wasinger, Erik C.; de Groot, Frank M. F.; Hodgson, Keith O.; Hedman, Britt; Solomon, Edward I. (August 2006). "Fe L-Edge XAS Studies of K4[Fe(CN)6] and K3[Fe(CN)6]: A Direct Probe of Back-Bonding". Journal of the American Chemical Society. 128 (32): 10442–10451. doi:10.1021/ja061802i.