People of Northern Ireland
| Total population | |
|---|---|
|
(1,810,863 89% of the population of Northern Ireland are native-born) | |
| Regions with significant populations | |
| Throughout Northern Ireland | |
| Religion | |
| Christianity (mostly Roman Catholicism, Presbyterianism, Anglicanism and Methodism) | |
| Related ethnic groups | |
|
British people Irish people |
The people of Northern Ireland are all people born in Northern Ireland and having, at the time of their birth, at least one parent who is a British citizen, an Irish citizen or is otherwise entitled to reside in Northern Ireland without any restriction on their period of residence,[1] under the Belfast Agreement.
For detailed information about Northern Ireland's population, see Demographics of Northern Ireland.
National identity
In Northern Ireland, national identity is complex and diverse. The three most common identities are British, Northern Irish and Irish. Most people of Protestant background consider themselves British, while a majority of people of Catholic background consider themselves Irish. This has origins in the 17th century Plantation of Ulster, when mainly-Catholic Ulster was colonized by Protestant settlers from Great Britain.
In the early 20th century, most Ulster Protestants and Catholics saw themselves as Irish, although Protestants tended to have a much stronger sense of Britishness.[2] With the onset of the Home Rule Crisis and events that followed, Protestants gradually began to abandon Irish identity,[2] as Irishness and Britishness became more and more to be seen as mutually exclusive. In 1968 – just before the onset of the Troubles – 39% of Protestants described themselves as British and 20% described themselves as Irish, while 32% chose an Ulster identity.[3] By 1978, following the worst years of the conflict, there had been a large shift in identity amongst Protestants, with the majority (67%) now calling themselves British and only 8% calling themselves Irish.[3][4] This shift has not been reversed.[4] Meanwhile, the majority of Catholics have continued to see themselves as Irish.[3]
From 1989, 'Northern Irish' began to be included as an identity choice in surveys, and its popularity has grown since then.[4] Some organizations have promoted 'Northern Irish' identity as a way of overcoming sectarian division. In a 1998 survey of students, this was one of the main reasons they gave for choosing that identity, along with a desire to appear 'neutral'.[5] However, surveys show that 'Northern Irish' identity tends to have different meanings for Catholics and Protestants.[5] Surveys also show that those choosing 'Northern Irish' regard their national identity as less important than those choosing British and Irish.[5]
In the 2011 census, respondents gave their national identity as follows:
| National Identity | Respondents |
|---|---|
| British | 876,577 |
| Northern Irish | 533,085 |
| Irish | 513,390 |
| English, Scottish or Welsh | 29,187 |
| Other | 61,884 |
National Identity by Religion[7]
| National Identity | All | Catholic | Protestant and other Christian | Other religions | No religion |
|---|---|---|---|---|---|
| British | 48.4% | 12.9% | 81.6% | 50.1% | 55.9% |
| Irish | 28.4% | 57.2% | 3.9% | 12.4% | 14.0% |
| Northern Irish | 29.4% | 30.7% | 26.9% | 18.0% | 35.2% |
| English, Scottish or Welsh | 1.6% | 0.8% | 1.5% | 2.9% | 5.2% |
| All other | 3.4% | 4.4% | 1.0% | 29.1% | 7.1% |
Detail by Religion[8]
| National Identity | All | Catholic | Protestant and other Christian | Other religions | No religion |
|---|---|---|---|---|---|
| British only | 39.9% | 10.3% | 68.3% | 42.4% | 42.9% |
| Irish only | 25.3% | 53.2% | 2.1% | 8.1% | 9.4% |
| Northern Irish only | 20.9% | 26.9% | 14.5% | 12.0% | 23.7% |
| British and Northern Irish only | 6.2% | 0.9% | 11.1% | 3.3% | 7.9% |
| Irish and Northern Irish only | 1.1% | 2.0% | 0.2% | 0.5% | 0.8% |
| British, Irish and Northern Irish only | 1.0% | 0.8% | 1.0% | 1.0% | 2.1% |
| British and Irish only | 0.7% | 0.8% | 0.5% | 0.7% | 1.0% |
| English, Scottish or Welsh only | 1.0% | 0.6% | 0.8% | 2.1% | 3.5% |
| Other | 4.0% | 4.7% | 1.6% | 29.9% | 8.7% |
| Total | 100.0% | 100.0% | 100.0% | 100.0% | 100.0% |
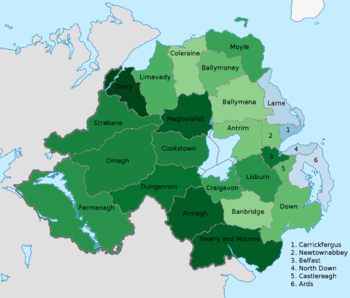
National Identity by District[9]
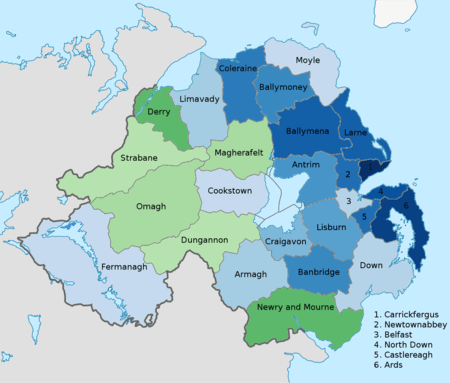
| District | British | Irish | Northern Irish | English, Scottish or Welsh | All Other |
|---|---|---|---|---|---|
| Antrim | 55.2% | 20.1% | 30.4% | 2.3% | 3.9% |
| Ards | 73.6% | 7.5% | 31.9% | 1.9% | 1.5% |
| Armagh | 44.4% | 32.4% | 27.1% | 1.1% | 3.9% |
| Ballymena | 69.0% | 11.1% | 27.9% | 1.4% | 3.8% |
| Ballymoney | 60.6% | 16.4% | 30.9% | 1.7% | 1.7% |
| Banbridge | 61.1% | 16.2% | 31.8% | 1.5% | 1.8% |
| Belfast | 43.2% | 34.8% | 26.8% | 1.5% | 5.1% |
| Carrickfergus | 76.5% | 5.3% | 30.3% | 2.1% | 1.8% |
| Castlereagh | 66.2% | 14.7% | 31.3% | 1.5% | 2.6% |
| Coleraine | 62.4% | 14.5% | 31.6% | 2.0% | 3.2% |
| Cookstown | 37.3% | 33.5% | 32.1% | 1.2% | 3.7% |
| Craigavon | 48.3% | 25.6% | 28.7% | 1.4% | 6.4% |
| Derry | 23.7% | 55.0% | 24.6% | 1.4% | 2.0% |
| Down | 40.2% | 32.2% | 34.1% | 1.9% | 2.0% |
| Dungannon | 30.9% | 38.8% | 27.1% | 0.9% | 9.6% |
| Fermanagh | 37.2% | 36.1% | 29.5% | 1.7% | 3.1% |
| Larne | 69.8% | 10.1% | 31.4% | 2.1% | 1.2% |
| Limavady | 42.2% | 32.0% | 30.7% | 1.5% | 1.4% |
| Lisburn | 55.6% | 24.7% | 28.7% | 2.0% | 2.4% |
| Magherafelt | 31.4% | 42.7% | 29.8% | 1.0% | 2.8% |
| Moyle | 38.6% | 34.1% | 32.1% | 2.2% | 1.4% |
| Newry and Mourne | 20.2% | 53.0% | 27.6% | 1.2% | 4.3% |
| Newtownabbey | 66.5% | 13.4% | 31.2% | 1.3% | 2.4% |
| North Down | 71.1% | 9.1% | 33.0% | 3.0% | 2.4% |
| Omagh | 28.6% | 40.9% | 32.7% | 1.1% | 3.4% |
| Strabane | 33.0% | 39.2% | 31.8% | 1.4% | 1.3% |
National identity by religion or religion brought up in for each district[9]
| District | Catholic | Protestant and other Christian | Other Religion or None | |||||||||
|---|---|---|---|---|---|---|---|---|---|---|---|---|
| British | Irish | Northern Irish | All Other | British | Irish | Northern Irish | All Other | British | Irish | Northern Irish | All Other | |
| Antrim | 23.1% | 43.7% | 34.2% | 7.1% | 80.6% | 3.1% | 27.8% | 3.3% | 60.4% | 6.5% | 26.8% | 19.0% |
| Ards | 34.1% | 31.7% | 38.2% | 6.4% | 80.9% | 3.7% | 30.4% | 2.2% | 67.7% | 6.0% | 35.1% | 9.1% |
| Armagh | 7.1% | 62.5% | 28.7% | 6.2% | 81.6% | 3.6% | 25.7% | 2.3% | 49.3% | 10.5% | 25.1% | 25.3% |
| Ballymena | 24.6% | 38.9% | 34.7% | 11.0% | 83.6% | 2.7% | 25.7% | 2.5% | 62.3% | 6.5% | 28.4% | 14.4% |
| Ballymoney | 19.0% | 44.5% | 38.8% | 4.1% | 81.1% | 2.9% | 27.2% | 2.2% | 65.1% | 8.4% | 28.0% | 13.3% |
| Banbridge | 22.6% | 41.7% | 39.4% | 4.5% | 81.2% | 3.8% | 27.7% | 2.0% | 59.1% | 8.3% | 33.8% | 11.5% |
| Belfast | 11.7% | 64.3% | 25.0% | 5.6% | 78.3% | 5.5% | 28.7% | 3.6% | 47.7% | 13.3% | 27.5% | 26.3% |
| Carrickfergus | 41.1% | 24.6% | 35.6% | 10.7% | 82.0% | 3.0% | 29.2% | 2.4% | 68.3% | 5.3% | 33.7% | 8.5% |
| Castlereagh | 22.1% | 50.0% | 34.5% | 6.3% | 81.3% | 3.9% | 29.9% | 2.3% | 61.9% | 8.9% | 33.7% | 11.8% |
| Coleraine | 25.0% | 39.2% | 36.5% | 8.4% | 79.1% | 4.3% | 29.3% | 2.6% | 56.5% | 10.3% | 33.4% | 16.8% |
| Cookstown | 8.1% | 53.8% | 37.7% | 5.2% | 82.5% | 3.6% | 24.0% | 2.1% | 44.2% | 9.1% | 24.4% | 31.5% |
| Craigavon | 12.2% | 51.2% | 31.5% | 10.6% | 82.5% | 3.2% | 26.3% | 2.7% | 49.9% | 9.1% | 26.7% | 26.4% |
| Derry | 7.3% | 70.5% | 24.3% | 2.5% | 76.7% | 7.2% | 25.9% | 3.5% | 39.4% | 24.7% | 21.9% | 26.2% |
| Down | 20.1% | 47.4% | 37.1% | 2.9% | 77.4% | 5.6% | 28.7% | 3.6% | 52.1% | 14.4% | 32.1% | 16.7% |
| Dungannon | 5.7% | 57.6% | 28.6% | 13.0% | 79.6% | 4.5% | 24.5% | 3.0% | 33.3% | 12.0% | 22.8% | 42.1% |
| Fermanagh | 11.4% | 56.2% | 32.4% | 4.8% | 77.1% | 6.2% | 25.5% | 3.0% | 43.4% | 16.8% | 24.0% | 28.1% |
| Larne | 38.8% | 30.6% | 37.7% | 3.0% | 81.7% | 3.0% | 28.6% | 2.5% | 64.1% | 6.5% | 35.4% | 12.1% |
| Limavady | 18.1% | 50.5% | 34.4% | 2.5% | 79.8% | 4.1% | 24.9% | 2.5% | 51.4% | 10.9% | 28.8% | 18.7% |
| Lisburn | 16.5% | 58.6% | 27.8% | 4.3% | 80.2% | 4.7% | 29.0% | 3.2% | 62.2% | 8.8% | 30.3% | 13.9% |
| Magherafelt | 6.5% | 62.1% | 33.0% | 3.8% | 82.4% | 4.2% | 23.1% | 2.3% | 46.9% | 13.4% | 30.2% | 22.1% |
| Moyle | 14.6% | 53.1% | 35.3% | 2.8% | 76.3% | 5.0% | 27.8% | 3.3% | 49.4% | 17.8% | 23.8% | 19.8% |
| Newry and Mourne | 7.1% | 64.7% | 28.0% | 5.0% | 76.3% | 5.8% | 26.8% | 3.8% | 34.6% | 22.8% | 22.1% | 28.9% |
| Newtownabbey | 24.7% | 46.1% | 34.1% | 5.7% | 80.9% | 3.4% | 30.1% | 1.7% | 63.1% | 7.3% | 32.1% | 12.3% |
| North Down | 37.1% | 31.5% | 36.1% | 9.7% | 78.8% | 5.2% | 31.9% | 3.4% | 63.7% | 7.9% | 35.7% | 11.6% |
| Omagh | 8.7% | 55.7% | 36.0% | 4.4% | 78.5% | 4.9% | 25.0% | 2.5% | 40.6% | 15.9% | 23.7% | 28.9% |
| Strabane | 8.9% | 57.4% | 35.4% | 2.6% | 79.2% | 4.7% | 25.2% | 1.9% | 40.9% | 21.1% | 25.5% | 26.4% |
National Identity by Age[6]
| Ages attained (years) | British | Irish | Northern Irish | English, Scottish or Welsh | All other |
|---|---|---|---|---|---|
| 0 to 15 | 45.1% | 31.4% | 30.5% | 0.9% | 3.6% |
| 16 to 24 | 44.2% | 32.3% | 29.6% | 1.5% | 3.3% |
| 25 to 34 | 40.5% | 31.0% | 30.0% | 1.7% | 8.6% |
| 35 to 44 | 47.3% | 28.7% | 29.3% | 2.1% | 4.5% |
| 45 to 54 | 50.8% | 28.3% | 28.0% | 1.9% | 2.2% |
| 55 to 64 | 54.5% | 24.9% | 28.8% | 1.9% | 1.1% |
| 65 to 74 | 57.5% | 21.3% | 29.8% | 1.7% | 0.4% |
| 75 to 84 | 58.6% | 19.6% | 29.1% | 1.6% | 0.3% |
| 85 and over | 61.7% | 18.0% | 26.5% | 2.0% | 0.2% |
Surveys
According to the Northern Ireland Life and Times Survey,[10] individuals from Northern Ireland identify as (best preference choice):
In the 2007 Northern Ireland Life and Times Survey,[11] the question was asked, "thinking about each of these national identities in turn, how strongly do you feel yourself to be [Irish/British/Northern Irish/Ulster?]" Individuals responded for each of the identities as follows:
Northern Irish
- Very strongly 50%
- Not very strongly 34%
- Not at all 15%
- Don't know 0%
British
- Very strongly 37%
- Not very strongly 41%
- Not at all 22%
- Don't know 0%
Irish
- Very strongly 36%
- Not very strongly 41%
- Not at all 23%
- Don't know 0%
Ulster
- Very strongly 31%
- Not very strongly 40%
- Not at all 28%
- Don't know 1%
See also
- Anglo-Irish
- Demography of Northern Ireland
- Scotch-Irish American
- Ulster Scots people
- Ulster Protestants
- List of districts in Northern Ireland by national identity
References
- ↑ The Good Friday Agreement guarantees the "recognition of the birthright of all the people of Northern Ireland to identify themselves and be accepted as Irish or British, or both, as they may so choose."
"Agreement reached in the multi-party negotiations". Conflict Archive on the INternet. University of Ulster. 10 April 1998. Retrieved 13 May 2008. - 1 2 Walker, Brian. "British or Irish - who do you think you are?". Belfast Telegraph, 10 December 2008.
- 1 2 3 Moxon-Browne, Edward. "National identity in Northern Ireland". Social Attitudes in Northern Ireland: First Report. Blackstaff Press, 1991.
- 1 2 3 Conflict and Consensus: A Study of Values and Attitudes in the Republic of Ireland and Northern Ireland. Institute of Public Administration, 2005. pp.60-62
- 1 2 3 McKeown, Shelley. Identity, Segregation and Peace-building in Northern Ireland. Palgrave Macmillan, 2013. p.32
- 1 2 "Northern Ireland Neighbourhood Information Service". Retrieved 25 July 2014.
- ↑ "Northern Ireland Neighbourhood Information Service". Retrieved 22 July 2014.
- ↑ "Northern Ireland Neighbourhood Information Service". Retrieved 22 July 2014.
- 1 2 "Northern Ireland Neighbourhood Information Service". Retrieved 22 July 2014.
- ↑ "Which of these best describes the way you think of yourself?". Northern Ireland Life and Times Survey. ARK - Access Research Knowledge. 2014. Retrieved 10 March 2016.
- ↑ "Northern Ireland Life and Times Survey 2007". Northern Ireland Life and Times Survey. ARK - Access Research Knowledge. 22 December 2009. Retrieved 9 October 2010.