Predictive modelling
Predictive modeling uses statistics to predict outcomes.[1] Most often the event one wants to predict is in the future, but predictive modelling can be applied to any type of unknown event, regardless of when it occurred. For example, predictive models are often used to detect crimes and identify suspects, after the crime has taken place.[2]
In many cases the model is chosen on the basis of detection theory to try to guess the probability of an outcome given a set amount of input data, for example given an email determining how likely that it is spam.
Models can use one or more classifiers in trying to determine the probability of a set of data belonging to another set, say spam or 'ham'.
Depending on definitional boundaries, predictive modelling is synonymous with, or largely overlapping with, the field of machine learning, as it is more commonly referred to in academic or research and development contexts. When deployed commercially, predictive modelling is often referred to as predictive analytics.
Models
Nearly any regression model can be used for prediction purposes. Broadly speaking, there are two classes of predictive models: parametric and non-parametric. A third class, semi-parametric models, includes features of both. Parametric models make "specific assumptions with regard to one or more of the population parameters that characterize the underlying distribution(s)",[3] while non-parametric regressions make fewer assumptions than their parametric counterparts.[4]
Group method of data handling
Naive Bayes
k-nearest neighbor algorithm
Majority classifier
The majority classifier takes non-anomalous data and incorporates it within its calculations. This ensures that the results produced by the predictive modelling system are as valid as possible.
Support vector machines
Random forests
Boosted trees
CART (Classification and Regression Trees)
MARS
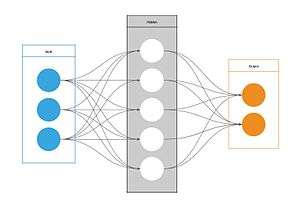
Neural Networks
Ordinary Least Square
Ordinary least squares is a method that minimizes the sum of squared distance between an observed and its predicted value.
Generalized Linear Models (GLM)
Generalized linear model is a flexible family of models that are unified under a single method. Logistic regression is a notable special case of GLM. Other types of GLM include Poisson regression, Gamma regression, Multinomial regression.
Logistic regression
Logistic regression is a technique in which unknown values of a discrete variable are predicted based on known values of one or more continuous and/or discrete variables. Logistic regression differs from ordinary least squares (OLS) regression in that the dependent variable is binary in nature. This procedure has many applications. In biostatistics, the researcher may be interested in trying to model the probability of a patient being diagnosed with a certain type of cancer based on knowing, say, the incidence of that cancer in his or her family. In business, the marketer may be interested in modelling the probability of an individual purchasing a product based on the price of that product. Both of these are examples of a simple, binary logistic regression model. The model is "simple" in that each has only one independent, or predictor, variable, and it is "binary" in that the dependent variable can take on only one of two values: cancer or no cancer, and purchase or does not purchase.
Generalized additive models
Generalized additive model is a smoothing method for multiple predictors that allows for non-parametric predictions.
Robust regression
Robust regression include a number of modelling approaches to handle high leverage observations or violation of assumptions. Models can be both parametric (e.g. regression with Huber, White, Sandwich variance estimators) as well as non-parametric(e.g. quantile regression).[5]
Semiparametric regression
Semiparametric regression include proportional odds model and the Cox proportional hazard model where the response is a rank.
Presenting and Using the Results of a Predictive Model
Predictive models can either be used directly to estimate a response (output) given a defined set of characteristics (input), or indirectly to drive the choice of decision rules.[6]
Depending on the methodology employed for the prediction, it is often possible to derive a formula that may be used in a spreadsheet software. This has some advantages for end users or decision makers, the main one being familiarity with the software itself, hence a lower barrier to adoption.
Nomograms are useful graphical representation of a predictive model. As in spreadsheet software, their use depends on the methodology chosen. The advantage of nomograms is the immediacy of computing predictions without the aid of a computer.
Point estimates tables are one of the simplest form to represent a predictive tool. Here combination of characteristics of interests can either be represented via a table or a graph and the associated prediction read off the y-axis or the table itself.
Tree based methods (e.g. CART, survival trees) provide one of the most graphically intuitive ways to present predictions. However, their usage is limited to those methods that use this type of modelling approach which can have several drawbacks.[7] Trees can also be employed to represent decision rules graphically.
Score charts are graphical tabular or graphical tools to represent either predictions or decision rules.
A new class of modern tools are represented by web based applications. For example, Shiny is a web based tool developed by Rstudio, an R IDE. With a Shiny app, a modeller has the advantage to represent any which way he or she chooses to represent the predictive model while allowing the user some control. A user can choose a combination of characteristics of interest via sliders or input boxes and results can be generated, from graphs to confidence intervals to tables and various statistics of interests. However, these tools often require a server installation of Rstudio.
Applications
Uplift Modelling
Uplift Modelling is a technique for modelling the change in probability caused by an action. Typically this is a marketing action such as an offer to buy a product, to use a product more or to re-sign a contract. For example, in a retention campaign you wish to predict the change in probability that a customer will remain a customer if they are contacted. A model of the change in probability allows the retention campaign to be targeted at those customers on whom the change in probability will be beneficial. This allows the retention programme to avoid triggering unnecessary churn or customer attrition without wasting money contacting people who would act anyway.
Archaeology
Predictive modelling in archaeology gets its foundations from Gordon Willey's mid-fifties work in the Virú Valley of Peru.[8] Complete, intensive surveys were performed then covariability between cultural remains and natural features such as slope, and vegetation were determined. Development of quantitative methods and a greater availability of applicable data led to growth of the discipline in the 1960s and by the late 1980s, substantial progress had been made by major land managers worldwide.
Generally, predictive modelling in archaeology is establishing statistically valid causal or covariable relationships between natural proxies such as soil types, elevation, slope, vegetation, proximity to water, geology, geomorphology, etc., and the presence of archaeological features. Through analysis of these quantifiable attributes from land that has undergone archaeological survey, sometimes the "archaeological sensitivity" of unsurveyed areas can be anticipated based on the natural proxies in those areas. Large land managers in the United States, such as the Bureau of Land Management (BLM), the Department of Defense (DOD),[9][10] and numerous highway and parks agencies, have successfully employed this strategy. By using predictive modelling in their cultural resource management plans, they are capable of making more informed decisions when planning for activities that have the potential to require ground disturbance and subsequently affect archaeological sites.
Customer relationship management
Predictive modelling is used extensively in analytical customer relationship management and data mining to produce customer-level models that describe the likelihood that a customer will take a particular action. The actions are usually sales, marketing and customer retention related.[11]
For example, a large consumer organisation such as a mobile telecommunications operator will have a set of predictive models for product cross-sell, product deep-sell and churn. It is also now more common for such an organisation to have a model of savability using an uplift model. This predicts the likelihood that a customer can be saved at the end of a contract period (the change in churn probability) as opposed to the standard churn prediction model.
Auto insurance
Predictive Modelling is utilised in vehicle insurance to assign risk of incidents to policy holders from information obtained from policy holders. This is extensively employed in usage-based insurance solutions where predictive models utilise telemetry based data to build a model of predictive risk for claim likelihood. Black-box auto insurance predictive models utilise GPS or accelerometer sensor input only. Some models include a wide range of predictive input beyond basic telemetry including advanced driving behaviour, independent crash records, road history, and user profiles to provide improved risk models.
Health care
In 2009 Parkland Health & Hospital System began analyzing electronic medical records in order to use predictive modeling to help identify patients at high risk of readmission. Initially the hospital focused on patients with congestive heart failure, but the program has expanded to include patients with diabetes, acute myocardial infarction, and pneumonia.[12]
Algorithmic Trading
The predictive modeling in trading is a modeling process wherein we predict the probability of an outcome using a set of predictor variables. Predictive models can be built for different assets like stocks, futures, currencies, commodities etc.[13] Predictive Modeling is still extensively used by trading firms to devise strategies and trade. It utilizes mathematically advanced software to evaluate indicators on price, volume, open interest and other historical data, to discover repeatable patterns.[14]
Notable failures of predictive modeling
Although not widely discussed by the mainstream predictive modeling community, predictive modeling is a methodology that has been widely used in the financial industry in the past and some of the spectacular failures have contributed to the financial crisis of 2008. These failures exemplify the danger of relying blindly on models that are essentially backforward looking in nature. The following examples are by no mean a complete list:
1) Bond rating. S&P, Moody's and Fitch quantify the probability of default of bonds with discrete variables called rating. The rating can take on discrete values from AAA down to D. The rating is a predictor of the risk of default based on a variety of variables associated with the borrower and macro-economic data that are drawn from historicals. The rating agencies failed spectacularly with their ratings on the 600 billion USD mortgage backed CDO market. Almost the entire AAA sector (and the super-AAA sector, a new rating the rating agencies provided to represent super safe investment) of the CDO market defaulted or severely downgraded during 2008, many of which obtained their ratings less than just a year previously.
2) Statistical models that attempt to predict equity market prices based on historical data. So far, no such model is considered to consistently make correct predictions over the long term. One particularly memorable failure is that of Long Term Capital Management, a fund that hired highly qualified analysts, including a Nobel Memorial Prize in Economic Sciences winner, to develop a sophisticated statistical model that predicted the price spreads between different securities. The models produced impressive profits until a spectacular debacle that caused the then Federal Reserve chairman Alan Greenspan to step in to broker a rescue plan by the Wall Street broker dealers in order to prevent a meltdown of the bond market.
Possible fundamental limitations of predictive model based on data fitting
1) History cannot always predict future: Using relations derived from historical data to predict the future implicitly assumes there are certain steady-state conditions or constants in the complex system. This is almost always wrong when the system involves people.
2) The issue of unknown unknowns: In all data collection, the collector first defines the set of variables for which data is collected. However, no matter how extensive the collector considers his selection of the variables, there is always the possibility of new variables that have not been considered or even defined, yet are critical to the outcome.
3) Self-defeat of an algorithm: After an algorithm becomes an accepted standard of measurement, it can be taken advantage of by people who understand the algorithm and have the incentive to fool or manipulate the outcome. This is what happened to the CDO rating. The CDO dealers actively fulfilled the rating agencies input to reach an AAA or super-AAA on the CDO they are issuing by cleverly manipulating variables that were "unknown" to the rating agencies' "sophisticated" models.
See also
References
- ↑ Geisser, Seymour (September 2016). Predictive Inference: An Introduction. New York: Chapman & Hall. p. . ISBN 0-412-03471-9. Check date values in:
|year= / |date= mismatch(help) - ↑ Finlay, Steven (2014). Predictive Analytics, Data Mining and Big Data. Myths, Misconceptions and Methods (1st ed.). Basingstoke: Palgrave Macmillan. p. 237. ISBN 978-1137379276.
- ↑ Sheskin, David J. (April 27, 2011). Handbook of Parametric and Nonparametric Statistical Procedures. Boca Raton, FL: CRC Press. p. 109. ISBN 1439858012.
- ↑ Marascuilo, Leonard A. (December 1977). Nonparametric and distribution-free methods for the social sciences. Brooks/Cole Publishing Co. ISBN 0818502029.
- ↑ Wilcox, Rand R. (March 18, 2010). Fundamentals of Modern Statistical Methods. New York: Springer. pp. 200–213. ISBN 1441955240.
- ↑ Steyerberg, Ewout W. (October 21, 2010). Clinical Prediction Models. New York: Springer. p. 313. ISBN 1441926488.
- ↑ Breiman, Leo (August 1996). "Bagging predictors". Machine Learning. 24 (2): 123–140. doi:10.1007/bf00058655.
- ↑ Willey, Gordon R. (1953) "Prehistoric Settlement Patterns in the Virú Valley, Peru", Bulletin 155. Bureau of American Ethnology
- ↑ Heidelberg, Kurt, et al. "An Evaluation of the Archaeological Sample Survey Program at the Nevada Test and Training Range", SRI Technical Report 02-16, 2002
- ↑ Jeffrey H. Altschul, Lynne Sebastian, and Kurt Heidelberg, "Predictive Modeling in the Military: Similar Goals, Divergent Paths", Preservation Research Series 1, SRI Foundation, 2004
- ↑ http://forteconsultancy.wordpress.com/2010/05/17/wondering-what-lies-ahead-the-power-of-predictive-modeling/
- ↑ "Hospital Uses Data Analytics and Predictive Modeling To Identify and Allocate Scarce Resources to High-Risk Patients, Leading to Fewer Readmissions". Agency for Healthcare Research and Quality. 2014-01-29. Retrieved 2014-01-29.
- ↑ "Implementing Predictive Modeling in R for Algorithmic Trading". 2016-10-07. Retrieved 2016-11-25.
- ↑ "Predictive-Model Based Trading Systems, Part 1 - System Trader Success". System Trader Success. 2013-07-22. Retrieved 2016-11-25.