Process Window Index
| Part of a series of articles on |
| Manufacturing |
|---|
 |
| Manufacturing methods |
| Improvement methods |
| Information and communication |
| Process control |
Process Window Index (PWI) is a statistical measure that quantifies the robustness of a manufacturing process, e.g. one which involves heating and cooling, known as a thermal process. In manufacturing industry, PWI values are used to calibrate the heating and cooling of soldering jobs (known as a thermal profile) while baked in a reflow oven.
PWI measures how well a process fits into a user-defined process limit known as the specification limit. The specification limit is the tolerance allowed for the process and may be statistically determined. Industrially, these specification limits are known as the process window, and values that a plotted inside or outside this window are known as the process window index.
Using PWI values, processes can be accurately measured, analyzed, compared, and tracked at the same level of statistical process control and quality control available to other manufacturing processes.
Statistical process control
Process capability is the ability of a process to produce output within specified limits.[1] To help determine whether a manufacturing or business process is in a state of statistical control, process engineers use control charts, which help to predict the future performance of the process based on the current process.[2]

To help determine the capability of a process, statistically determined upper and lower limits are drawn on either side of a process mean on the control chart.[2] The control limits are set at three standard deviations on either side of the process mean, and are known as the upper control limit (UCL) and lower control limit (LCL) respectively.[2] If the process data plotted on the control chart remains within the control limits over an extended period, then the process is said to be stable.[2][3]
The tolerance values specified by the end-user are known as specification limits – the upper specification limit (USL) and lower specification limit (LSL) respectively.[2] If the process data plotted on a control chart remains within these specification limits, then the process is considered a capable process, denoted by .[2][3]

Manufacturing industry has developed customized specification limits known as Process Windows. Within this process window, values are plotted. The values relative to the process mean of the window are known as the Process Window Index. By using PWI values, processes can be accurately measured, analyzed, compared, and tracked at the same level of statistical process control and quality control available to other manufacturing processes.[3]
PWI in electronics manufacturing
.svg.png)
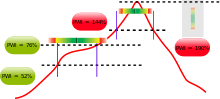
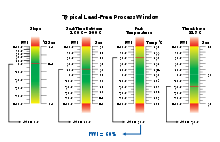
An example of a process to which the PWI concept may be applied is soldering. In soldering, a thermal profile is the set of time-temperature values for a variety of processes such as slope, thermal soak, reflow, and peak.[4]
Each thermal profile is ranked on how it fits in a process window (the specification or tolerance limit).[5] Raw temperature values are normalized in terms of a percentage relative to both the process mean and the window limits. The center of the process window is defined as zero, and the extreme edges of the process window are ±99%.[5] A PWI greater than or equal to 100% indicates that the profile does not process the product within specification. A PWI of 99% indicates that the profile runs at the edge of the process window.[5] For example, if the process mean is set at 200 °C, with the process window calibrated at 180 °C and 220 °C respectively; then a measured value of 188 °C translates to a process window index of −60%. A lower PWI value indicates a more robust profile.[4][5] For maximum efficiency, separate PWI values are computed for peak, slope, reflow, and soak processes of a thermal profile.
To avoid thermal shock affecting production, the steepest slope in the thermal profile is determined and leveled. Manufacturers use custom-built software to accurately determine and decrease the steepness of the slope. In addition, the software also automatically recalibrates the PWI values for the peak, slope, reflow, and soak processes. By setting PWI values, engineers can ensure that the reflow soldering work does not overheat or cool too quickly.[4]
Formula
The Process Window Index is calculated as the worst case (i.e. highest number) in the set of thermal profile data. For each profile statistic the percentage used of the respective process window is calculated, and the worst case (i.e. highest percentage) is the PWI.
For example, a thermal profile with three thermocouples, with four profile statistics logged for each thermocouple, would have a set of twelve statistics for that thermal profile. In this case, the PWI would be the highest value among the twelve percentages of the respective process windows.
The formula to calculate PWI is:[6]
![\text{PWI} = 100 \times \max_{i=1\dots N \atop j=1\dots M}
\left\{\left|
\frac{\text{measured value}_{[i,j]} - \text{average limits}_{[i,j]}} {\text{range}_{[i,j]}/2}
\right|\right\}](../I/m/b52d18af2bdb9154fa92b6dca5617e14f70a6b11.svg)
where:[6]
- i = 1 to N (number of thermocouples)
- j = 1 to M (number of statistics per thermocouple)
- measured value [i, j] = the [i, j]th statistic's measured value
- average limits [i, j] = the average of the high and low (specified) limits of the [i, j']th statistic
- range [i, j] = the high limit minus the low limit of the [i, j]th statistic
See also
Notes
- ↑ "What is Process Capability?". NIST/Sematech Engineering Statistics Handbook. National Institute of Standards and Technology. Retrieved 2008-06-22. External link in
|work=(help) - 1 2 3 4 5 6 Godfrey, A. B (September 1, 2000). Juran's Quality Handbook (5th ed.). McGraw-Hill. ISBN 9780070340039.
- 1 2 3 Hall, Jim; Zarrow, Phil (February 2002). PWI: Process Optimization Made Simple (PDF). Circuits Assembly Magazine.
- 1 2 3 Houston, Paul N; Brian J. Louis; Daniel F. Baldwin; Philip Kazmierowicz. "Taking the Pain Out of Pb-free Reflow" (PDF). Lead-Free Magazine. p. 3. Retrieved 2008-12-10.
- 1 2 3 4 "A Method for Quantifying Thermal Profile Performance". KIC Thermal. Archived from the original on 2010-09-30. Retrieved 2010-09-30.
- 1 2 Kazmierowicz, Phil (2003). "Process Control". SMT Magazine. Retrieved 2008-12-10.