Representative Concentration Pathways
Representative Concentration Pathways (RCPs) are four greenhouse gas concentration (not emissions) trajectories adopted by the IPCC for its fifth Assessment Report (AR5) in 2014.[1] It supersedes Special Report on Emissions Scenarios (SRES) projections published in 2000.
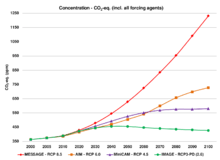
The pathways are used for climate modeling and research. They describe four possible climate futures, all of which are considered possible depending on how much greenhouse gases are emitted in the years to come. The four RCPs, RCP2.6, RCP4.5, RCP6, and RCP8.5, are named after a possible range of radiative forcing values in the year 2100 relative to pre-industrial values (+2.6, +4.5, +6.0, and +8.5 W/m2, respectively).[2]
Emissions
The RCPs are consistent with a wide range of possible changes in future anthropogenic (i.e., human) greenhouse gas (GHG) emissions.[3] RCP 2.6 assumes that global annual GHG emissions (measured in CO2-equivalents) peak between 2010-2020, with emissions declining substantially thereafter.[4] Emissions in RCP 4.5 peak around 2040, then decline.[4] In RCP 6, emissions peak around 2080, then decline.[4] In RCP 8.5, emissions continue to rise throughout the 21st century.[4]
The four RCPs are consistent with certain socio-economic assumptions but are to be substituted with the Shared Socio-economic Pathways which are anticipated to provide flexible descriptions of possible futures within each RCP.
Projections based on the RCPs
- 21st century
Mid- and late-21st century (2046-2065 and 2081-2100 averages, respectively) projections of global warming and global mean sea level rise from the IPCC Fifth Assessment Report (IPCC AR5 WG1) are tabulated below. The projections are relative to temperatures and sea levels in the late-20th to early-21st centuries (1986-2005 average). Temperature projections can be converted to a reference period of 1850-1900 or 1980-99 by adding 0.61 or 0.11 °C, respectively.[5]
| 2046-2065 | 2081-2100 | |
| Scenario | Mean and likely range | Mean and likely range |
| RCP2.6 | 1.0 (0.4 to 1.6) | 1.0 (0.3 to 1.7) |
| RCP4.5 | 1.4 (0.9 to 2.0) | 1.8 (1.1 to 2.6) |
| RCP6.0 | 1.3 (0.8 to 1.8) | 2.2 (1.4 to 3.1) |
| RCP8.5 | 2.0 (1.4 to 2.6) | 3.7 (2.6 to 4.8) |
Across all RCPs, global mean temperature is projected to rise by 0.3 to 4.8 °C by the late-21st century.
| 2046-2065 | 2081-2100 | |
| Scenario | Mean and likely range | Mean and likely range |
| RCP2.6 | 0.24 (0.17 to 0.32) | 0.40 (0.26 to 0.55) |
| RCP4.5 | 0.26 (0.19 to 0.33) | 0.47 (0.32 to 0.63) |
| RCP6.0 | 0.25 (0.18 to 0.32) | 0.48 (0.33 to 0.63) |
| RCP8.5 | 0.30 (0.22 to 0.38) | 0.63 (0.45 to 0.82) |
Across all RCPs, global mean sea level is projected to rise by 0.26 to 0.82 m by the late-21st century.
- 23rd century
AR5 also projects changes in climate beyond the 21st century. The extended RCP2.6 pathway assumes sustained net negative anthropogenic GHG emissions after the year 2070.[3] "Negative emissions" means that in total, humans absorb more GHGs from the atmosphere than they release. The extended RCP8.5 pathway assumes continued anthropogenic GHG emissions after 2100.[3] In the extended RCP 2.6 pathway, atmospheric CO2 concentrations reach around 360 ppmv by 2300, while in the extended RCP8.5 pathway, CO2 concentrations reach around 2000 ppmv in 2250, which is nearly seven times the pre-industrial level.[3]
For the extended RCP2.6 scenario, global warming of 0.0 to 1.2 °C is projected for the late-23rd century (2281-2300 average), relative to 1986-2005.[6] For the extended RCP8.5, global warming of 3.0 to 12.6 °C is projected over the same time period.[6]
References
- ↑ Richard Moss; Mustafa Babiker; Sander Brinkman; Eduardo Calvo; Tim Carter; Jae Edmonds; Ismail Elgizouli; Seita Emori; Lin Erda; Kathy Hibbard; Roger Jones; Mikiko Kainuma; Jessica Kelleher; Jean Francois Lamarque; Martin Manning; Ben Matthews; Jerry Meehl; Leo Meyer; John Mitchell; Nebojsa Nakicenovic; Brian O’Neill; Ramon Pichs; Keywan Riahi; Steven Rose; Paul Runci; Ron Stouffer; Detlef van Vuuren; John Weyant; Tom Wilbanks; Jean Pascal van Ypersele & Monika Zurek (2008). Towards New Scenarios for Analysis of Emissions, Climate Change, Impacts, and Response Strategies (PDF). Geneva: Intergovernmental Panel on Climate Change. p. 132.
- ↑ John Weyant, Christian Azar, Mikiko Kainuma, Jiang Kejun, Nebojsa Nakicenovic, P.R. Shukla, Emilio La Rovere and Gary Yohe (2009). Report of 2.6 Versus 2.9 Watts/m2 RCPP Evaluation Panel (PDF). Geneva, Switzerland: IPCC Secretariat.
- 1 2 3 4 Collins, M., et al.: Section 12.3.1.3 The New Concentration Driven RCP Scenarios, and their Extensions, in: Chapter 12: Long-term Climate Change: Projections, Commitments and Irreversibility (archived 16 July 2014), in: IPCC AR5 WG1 2013, pp. 1045–1047
- 1 2 3 4 Figure 2, in Meinshausen & others 2011, p. 223
- 1 2 3 IPCC: Table SPM-2, in: Summary for Policymakers (archived 16 July 2014), in: IPCC AR5 WG1 2013, p. 21
- 1 2 Collins, M., et al.: Executive summary, in: Chapter 12: Long-term Climate Change: Projections, Commitments and Irreversibility (archived 16 July 2014), in: IPCC AR5 WG1 2013, p. 1033
Note: The following references are cited in this article using Template:Harvard citation no brackets:
- IPCC AR5 WG1 (2013), Stocker, T.F.; et al., eds., Climate Change 2013: The Physical Science Basis. Working Group 1 (WG1) Contribution to the Intergovernmental Panel on Climate Change (IPCC) 5th Assessment Report (AR5), Cambridge University Press. [Archived 16 July 2014.
- Meinshausen, M.; et al. (November 2011), "The RCP greenhouse gas concentrations and their extensions from 1765 to 2300 (open access)", Climatic Change, 109 (1-2): 213–241, doi:10.1007/s10584-011-0156-z.
External links
- RCP Database
- Special Issue: The representative concentration pathways: an overview, Climatic Change, Volume 109, Issue 1-2, November 2011. Most papers in this issue are freely accessible.
- The Guardian: A guide to the IPCC's new RCP emissions pathways
- G.P. Wayne: The Beginner's Guide to Representative Concentration Pathways
- Jubb, I., Canadell, P. and Dix, M. 2013. Representative Concentration Pathways: Australian Climate Change Science Program Information paper