Reverse northern blot
The reverse northern blot is a method by which gene expression patterns may be analyzed by comparing isolated RNA molecules from a tester sample to samples in a control cDNA library. It is a variant of the northern blot in which the nucleic acid immobilized on a membrane is a collection of isolated DNA fragments rather than RNA, and the probe is RNA extracted from a tissue and radioactively labelled. A reverse northern blot can be used to profile expression levels of particular sets of RNA sequences in a tissue or to determine presence of a particular RNA sequence in a sample.[1] Although DNA Microarrays and newer next-generation techniques have generally supplanted reverse northern blotting, it is still utilized today and provides a relatively cheap and easy means of defining expression of large sets of genes.
Procedure
In order to prepare the reverse northern membrane, cDNA sequences for transcripts of interest are immobilized on nylon membranes, which can be accomplished by use of dot blots or bidirectional agarose gel blotting and UV fixation of the DNA to the membranes. In many cases, cDNA probes may be preferred over RNA probes in order to mitigate problems of RNA degradation by RNAses or tissue metabolites.[2] Prepared reverse northern blot membranes are pre-hybridized in Denhardt’s solution with SSC buffer and labeled cDNA probes are denatured at 100 °C and added to the pre-hybridization solution. The membrane is incubated with the probes for at least 15 hours at 65 °C, then washed and exposed.[3]
Applications
Quantification of mRNA expression levels
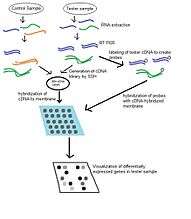
Reverse Northern blot, much like the northern blot upon which it is based, is used to determine levels of gene expression in particular tissues. In comparison to the Northern blot, the reverse northern blot is able to probe a large number of transcripts at once with less specificity with regard to probes than is required for Northern blot.[4] Often this will involve the use of suppression subtractive hybridization (SSH) libraries or differential display to isolate differentially expressed transcripts and create bacterial clones containing inserts for these sequences. These will serve as the targets hybridized to the membrane and will be probed by sample RNA. Expression levels can be quantified by increase or decrease in fluorescent or radioactive signal over a control treatment.[3] Bands or dots which appear darker and larger signify transcripts which are over-expressed in a sample of interest and lighter dots indicate that a transcript is down-regulated versus a control sample.
Confirmation of differential display results
Due to a tendency to generate high numbers of false positives caused by band contamination with heterogeneous sequences, differential display hits will need to be confirmed by an alternative method for determining differential expression.[5] While northern blot or q-PCR are often used to confirm results, both techniques have drawbacks. Northern blot is limited by its ability to only probe with one mRNA at a time, while q-PCR requires transcripts to be long enough to generate primers for the sequence and probes can be costly. Therefore, reverse northern has been used as one means of confirming hits from DD-PCR, or sequences with altered expression levels. In this case, the membrane will be coated with amplified DD-PCR products which have been cloned into vectors, sequenced, and reamplified.[4]
DNA Microarrays
DNA microarrays operate by similar procedures to those used in the reverse northern blot, consisting of many DNA probes hybridized to a solid glass, plastic or silicon substrate which is probed with labeled RNA or cDNA. This allows for significantly expanded gene expression profiling.[6] Arrays may be purchased from commercial suppliers tailored to research needs eg. cancer, cell cycle, or toxicology microarrays, or may be generated for custom targets.[7] Fluorescent or radioactive signals generated by hybridization of isolated sample cDNA probes will be proportional to the transcript's abundance in the tissue being studied.[8]
Research Applications
- Reverse northern blotting was used in a 2013 study in Gene in which the author identified a number of genes responsible for early cold-resistance response in the cold-hardy citrus fruit Poncirus trifoliata. Suppression subtractive hybridization libraries were formed from cold treated and control plants and cDNA clones were sequenced and hybridized to a membrane, which was probed with DIG-labeled cDNA from both control and cold-treated plants. Genes which saw particularly strong upregulation included genes for cell rescue and defense, cell metabolism and transcriptional regulation. These included Ribulose-1,5-bisphosphate carboxylase oxygenase activase, which regulates the photosynthetic enzyme RuBisCO, GAPDH, which is involved in glycolysis and oxidative stress response, as well as cell division control protein CDC91 and the NBS-LLR disease resistance gene. These results were then confirmed by qPCR.[9]
- A study utilized the technique to determine differences in striatal tissue in rats treated with 3-NP, which is often used in experiments to generate a Huntington’s Disease-like phenotype in rats. Forward and reverse suppression subtractive hybridization were used to generate profiles of gene over and under expression, and these libraries were used to blot two membranes. Aside from similar lesion appearances in the dissected rat brains, the group observed significantly increased expression of Profilin-2 (Pfn2) in the striatum. Its overexpression is connected to a decrease in actin polymerization and consequent lower dendritic spine density.[10]
See also
References
- ↑ Primrose, Sandy B.; Twyman, Richard (2009-04-01). Principles of Genome Analysis and Genomics. John Wiley & Sons. ISBN 9781444311280.
- ↑ Jaakola, Laura (2001). "CDNA Blotting Offers An Alternative Method For Gene Expression Studies". Plant Molecular Biology Reporter.
- 1 2 Bowler, Dr Chris (2002-01-01). Molecular Plant Biology: A Practical Approach. Oxford University Press. ISBN 9780199638185.
- 1 2 Dilks, Daniel W; Ring, Robert H; Khawaja, Xavier Z; Novak, Thomas J; Aston, Christopher (2003-02-15). "High-throughput confirmation of differential display PCR results using reverse Northern blotting". Journal of Neuroscience Methods. 123 (1): 47–54. doi:10.1016/S0165-0270(02)00343-6.
- ↑ Callard, D.; Lescure, B.; Mazzolini, L. (1994). "A method for the elimination of false positives generated by the mRNA differential display technique". Biotechniques.
- ↑ Tomar, Rukam S. (2010-01-15). Molecular Markers and Plant Biotechnology. New India Publishing. ISBN 9789380235257.
- ↑ Kurnaz, Isil Aksan (2015-05-08). Techniques in Genetic Engineering. CRC Press. ISBN 9781482260908.
- ↑ Offermanns, Stefan. Encyclopedia of Molecular Pharmacology. Springer Science & Business Media. ISBN 9783540389163.
- ↑ Şahin-Çevik, Mehtap (2013-01-10). "Identification and expression analysis of early cold-induced genes from cold-hardy Citrus relative Poncirus trifoliata (L.) Raf.". Gene. 512 (2): 536–545. doi:10.1016/j.gene.2012.09.084.
- ↑ Chakraborty, J.; Pandey, M.; Navneet, A.K.; Appukuttan, T.A.; Varghese, M.; Sreetama, S.C.; Rajamma, U.; Mohanakumar, K.P. "Profilin-2 increased expression and its altered interaction with β-actin in the striatum of 3-nitropropionic acid-induced Huntington's disease in rats". Neuroscience. 281: 216–228. doi:10.1016/j.neuroscience.2014.09.035.
External links
screening of gene expression difference enriched by differential display