ShoreZone
ShoreZone is an aerial imaging, habitat classification, and mapping system used to inventory alongshore and across-shore geomorphological and biological attributes of the coast. Habitat attributes are interpreted from oblique aerial imagery acquired during the lowest tides of the year. The mapping project was first developed as an oil spill response tool for British Columbia, and now ShoreZone extends from Oregon to Alaska and has many other uses including ecological studies, marine conservation planning, coastal flooding and vulnerability assessments, and community education.[1][2]
Development
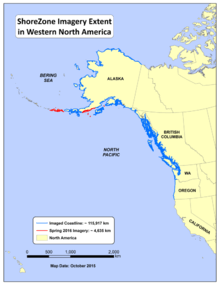
ShoreZone was originally the Physical Shore-zone Mapping System and first implemented in 1979 on Saltspring Island, British Columbia.[3] A decade of further development resulted in the first protocols published by the British Columbia Ministry of the Environment.[4] A compatible biological classification was developed in the early 1990s and the fully integrated biophysical mapping system was first applied to Gwaii Haanas National Park, and the remainder of British Columbia was completed from 1991 to 2007. The State of Washington was imaged and mapped between 1994-2000,[5] and the coast of Oregon was imaged in 2011 and mapped in 2013.[6] The Alaska program began in 2001 with the imaging of Cook Inlet and the program continues today with a project for the Eastern Aleutian Islands planned in 2016 as well as a portion of the Alaska Peninsula (see map). The spatially contiguous database of imagery and habitat attributes now includes over 100,000 km of shoreline extending from Oregon to Alaska's North Slope.[7] The Alaska portion of the database is part of the Alaska Ocean Observing System and the Integrated Ocean Observing System. Beginning in 2016, the aerial images are now digitally processed to create orthophoto mosaics and three-dimensional elevation models using Structure From Motion.[8] In areas where a temporal sequence of imagery exists, such as in Cook Inlet Alaska and the North Coast of British Columbia, the time series are analysed to quantify shoreline erosion or accretion and vulnerability to flooding in the context of sea level rise and changing wave dynamics. The digital post-processing of orthophotos also allows for quantitative measurements of shoreline unit dimensions and percent cover of substrate, epiflora and epifauna.
Partnership
The ShoreZone mapping program is maintained by a unique consortium with no binding agreement. The consortium currently consists of over 50 local, regional, and national partners including First Nations, various industries, non-profits, state, provincial and federal governments. This partnership won the 2009 Coastal America Spirit Award that recognizes "exceptional projects that demonstrate the 'spirit' of teamwork for group efforts that are poised to address our challenging coastal issues.”[9] In the United States, the Oregon ShoreZone is supported by the Oregon Department of Fish and Wildlife and the Oregon Coastal Management Program. The Washington ShoreZone is supported by the Washington Department of Natural Resources. The Alaska ShoreZone has on-going support from the National Marine Fisheries Service (NMFS) of the National Oceanic and Atmospheric Administration (NOAA) that also manages and distributes the imagery and data.[10] In Canada, the British Columbia ShoreZone is distributed by GeoBC. The Nature Conservancy coordinates the program and hosts the project website.[11] ShoreZone is a registered trademark of Coastal and Ocean Resources.
Utility
Coastal resource managers need an inventory of habitats and associated biota that are threatened by increasing development and encroachment along coastal areas, as well as the indirect effects of human activities. Coastal mapping efforts, such as ShoreZone, to a large extent fulfil these needs by providing physical and biological characterizations of the shoreline. The ShoreZone imagery and maps were originally intended as an oil spill response tool, and notably the data have been used in several emergency situations including the grounding in 2012 of the drilling barge Kulluk near Kodiak, Alaska.[12] Although the majority of users access only the imagery, the regional scale habitat attribute data have been used for ecological modelling and marine conservation planning.[13] [14] More recently the data are benefiting NOAA climate resilience studies. [15] Recent improvements in quantifying habitat attributes allow for analytical studies such as estimating potential Blue Carbon resources of salt marshes.[16] The imagery also has aesthetic appeal and is used for art exhibits,[17] exploring,[18] books,[19] and story maps.[20]
Assessments
Over 450 ground stations have been used to inform the mapping process and to evaluate the accuracy of the interpreted aerial imagery. The utility of ShoreZone maps for change detection has been assessed, and findings include: 1) the NOAA Coast63 digital shoreline used by ShoreZone in Alaska poorly resolves features less than 50 meters, i.e., many small scale features are not represented and thus cannot be accurately described; 2) ShoreZone has no explicit minimum or maximum mapping unit resulting in inconsistent placement of unit breaks among mappers; 3) the combination of 1 & 2 contributes to the lack of repeatability of unit breaks leading to potential false positive and false negative indications of change at the scale of individual shore units; and 4) users must be cognizant of the limitations imposed by qualitative mapping protocols used prior to 2016.[21]
References
- ↑ "Born in spill planning, uses for ShoreZone tool expanding". The Alaska Journal of Commerce.
- ↑ Alaska Newspapers, Inc. "ShoreZone collaboration brings filmmaking to Arctic students".
- ↑ http://archives.eopugetsound.org/conf/2001PS_ResearchConference/sessions/oral/3a_howes.pdf
- ↑ "Coastal Resource Information System (CRIMS)".
- ↑ http://file.dnr.wa.gov/publications/aqr_nrsh_szusermanual.pdf
- ↑ "Oregon ShoreZone".
- ↑ "ShoreZone".
- ↑ "'Structure-from-Motion' photogrammetry: A low-cost, effective tool for geoscience applications".
- ↑ "Coastal America Partnership".
- ↑ "Alaska ShoreZone Coastal Mapping and Imagery | NOAA Fisheries Alaska Regional Office". alaskafisheries.noaa.gov. Retrieved 2016-03-04.
- ↑ "Alaska: ShoreZone Science - The Nature Conservancy".
- ↑ "New Cook Inlet spill tool makes debut during Kulluk grounding". The Alaska Journal of Commerce.
- ↑ "An Estuarine Habitat Classification for a Complex Fjordal Island Archipelago".
- ↑ "BCMCA: overview". BC Marine Conservation Analysis.
- ↑ "Alaska ShoreZone Coastal Mapping and Imagery".
- ↑ https://afs.confex.com/afs/2015/webprogram/Paper23116.html
- ↑ "ShoreZone: Art Meets Science on the Alaska Coastline".
- ↑ "Getting up close and personal with Alaska's coast - Alaska Dispatch News". Alaska Dispatch News.
- ↑ "Cook Inlet Regional Citizens Advisory Council - A Photographic Journey along Alaska's Gulf Coast".
- ↑ "Story Map Tour".
- ↑ http://www.sf.adfg.state.ak.us/FedAidPDFs/FDS11-63.pdf