Taupō (New Zealand electorate)
Taupō (before 2008 styled as Taupo with no macron) is a New Zealand parliamentary electorate returning one Member of Parliament to the House of Representatives. Taupo first existed between 1963 and 1981, and was recreated for the introduction of MMP in 1996. The current MP for Taupō is Louise Upston of the National Party. She has held this position since 2008.
Population centres
The Taupo electorate was first created for the 1963 election and it existed until 1981. The former electorate was much smaller than the current one, since it did not contain the western side of Lake Taupō, nor Cambridge, nor the Ruapehu towns. It was a marginal seat and frequently changed between National and Labour.
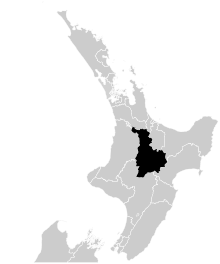
The current Taupō electorate was created ahead of the introduction to mixed-member proportional (MMP) voting in 1996. It is a merger of the old marginal seat of Tongariro with the western half of the safe National seat of Waikaremoana. The current electorate is centred around Taupō district and its main towns of Taupo, Turangi and Mangakino, with the South Waikato District towns of Tokoroa, Tirau and Putaruru. Prior to the 2008 election, the electorate pulled south to take in the northern and western parts of Ruapehu District.
In the 2007 redistribution conducted after the 2006 census, the northern and western parts of Ruapehu District containing Taumarunui, Raetihi and Ohakune were assigned to Rangitīkei. At the same time, low population growth in the south-central North Island coupled with high population growth in and around Auckland has meant Cambridge moved out of the now defunct Piako electorate and into Taupō.[1] No boundary adjustments were undertaken in the subsequent 2013/14 redistribution.[2]
History
Taupō has twice returned Mark Burton with a majority of around a thousand - in 1996, when Labour's post-1990 fortunes were at their lowest and New Zealand First went on to take a large bite out of their vote; and again in 2005, when National consolidated the centre-right vote, and at the same time won 2,000 more party votes than Burton's Labour party. At the intermediate two MMP elections, Burton was safely returned, thanks in part to a heavy disenchantment with the National Party among its formerly loyal voters. In the political climate in 2008, with the dominance of the National Party in Cambridge, which contributed over ten thousand new voters to the seat, Louise Upston won the seat with a majority of over 6,000.[3][4] In the 2011 election, Upston more than doubled her majority to 14,115 votes.[5] Her majority increased to 15,046 votes in the 2014 election.[6]
Members of Parliament
Unless otherwise stated, all MPs' terms began and ended at general elections.
| Election | Winner | |
|---|---|---|
| 1963 election | Rona Stevenson | |
| 1966 election | ||
| 1969 election | ||
| 1972 election | Jack Ridley | |
| 1975 election | Ray La Varis | |
| 1978 election | Jack Ridley | |
| 1981 election | Roger McClay | |
| (Electorate abolished 1984–1996; see Tongariro and Waikaremoana) | ||
| 1996 election | Mark Burton | |
| 1999 election | ||
| 2002 election | ||
| 2005 election | ||
| 2008 election | Louise Upston | |
| 2011 election | ||
| 2014 election | ||
As of 2014 no candidates that have contested the Taupō electorate have been returned as list MPs.
Election results
2014 election
| General election 2014: Taupō[5] | |||||||||
|---|---|---|---|---|---|---|---|---|---|
|
Notes: Green background denotes the winner of the electorate vote.
| |||||||||
| Party | Candidate | Votes | % | ±% | Party Votes | % | ±% | ||
| National | |
22,428 | 62.59 | -1.06 | 20,703 | 56.94 | +0.63 | ||
| Labour | Jamie Strange | 7,402 | 20.64 | -0.09 | 6,752 | 18.57 | -1.71 | ||
| NZ First | Edwin Perry | 2,310 | 6.44 | +1.85 | 3,730 | 10.26 | +1.87 | ||
| Green | Dave Robinson | 1,934 | 5.39 | -0.86 | 2,224 | 6.12 | -1.43 | ||
| Conservative | Lance Gedge | 891 | 2.48 | -0.26 | 1,236 | 4.75 | +1.09 | ||
| Māori | Claire Winitana | 366 | 1.02 | +1.02 | 298 | 0.82 | +0.15 | ||
| United Future | Alan Simmons | 143 | 0.40 | -0.26 | 94 | 0.26 | -0.66 | ||
| Democrats | John Pemberton | 71 | 0.20 | +0.20 | 29 | 0.08 | +0.02 | ||
| Ban 1080 | 223 | 0.61 | +0.61 | ||||||
| Internet Mana | 190 | 0.52 | +0.11 | ||||||
| Legalise Cannabis | 148 | 0.41 | -0.06 | ||||||
| ACT | 91 | 0.25 | -0.91 | ||||||
| Civilian | 13 | 0.03 | +0.03 | ||||||
| Independent Coalition | 10 | 0.03 | +0.03 | ||||||
| Focus | 7 | 0.02 | +0.02 | ||||||
| Informal votes | 299 | 121 | |||||||
| Total Valid votes | 35,384 | 36,362 | |||||||
| National hold | Majority | 13,951 | 38.37 | -4.55 | |||||
2011 election
| General election 2011: Taupō[5] | |||||||||
|---|---|---|---|---|---|---|---|---|---|
|
Notes: Green background denotes the winner of the electorate vote.
| |||||||||
| Party | Candidate | Votes | % | ±% | Party Votes | % | ±% | ||
| National | |
20,934 | 63.65 | +5.74 | 19,003 | 56.31 | +2.74 | ||
| Labour | Frances Campbell | 6,819 | 20.73 | -18.71 | 6,844 | 20.28 | -8.92 | ||
| Green | Zane McCarthy | 2,056 | 6.25 | +6.25 | 2,549 | 7.55 | +3.05 | ||
| NZ First | Edwin Perry | 1,508 | 4.59 | +4.59 | 2,833 | 8.39 | +3.25 | ||
| Conservative | Mark Breetvelt | 900 | 2.74 | +2.74 | 1,236 | 3.66 | +3.66 | ||
| Mana | Keriana Reedy | 266 | 0.81 | +0.81 | 140 | 0.41 | +0.41 | ||
| United Future | Alan Simmons | 216 | 0.66 | -0.42 | 311 | 0.92 | +0.12 | ||
| ACT | Rosanne Jollands | 190 | 0.58 | +0.58 | 394 | 1.17 | -2.34 | ||
| Māori | 226 | 0.67 | -0.25 | ||||||
| Legalise Cannabis | 157 | 0.47 | +0.13 | ||||||
| Libertarianz | 22 | 0.07 | +0.03 | ||||||
| Democrats | 20 | 0.06 | -0.01 | ||||||
| Alliance | 12 | 0.04 | -0.02 | ||||||
| Informal votes | 721 | 239 | |||||||
| Total Valid votes | 32,889 | 33,747 | |||||||
| National hold | Majority | 14,115 | 42.92 | +24.45 | |||||
Electorate (as at 26 November 2011): 45,800[7]
2008 election
| General election 2008: Taupō[4] | |||||||||
|---|---|---|---|---|---|---|---|---|---|
|
Notes: Green background denotes the winner of the electorate vote.
| |||||||||
| Party | Candidate | Votes | % | ±% | Party Votes | % | ±% | ||
| National | Louise Upston | 20,211 | 57.91 | +16.84 | 19,001 | 53.57 | +9.32 | ||
| Labour | |
13,766 | 39.44 | -6.06 | 10,359 | 29.20 | -8.10 | ||
| United Future | Max Edwards | 377 | 1.08 | -0.98 | 284 | 0.80 | -1.81 | ||
| Independent | Robbie Mac | 313 | 0.90 | ||||||
| Independent | Martin Bloxham | 236 | 0.68 | ||||||
| NZ First | 1,824 | 5.14 | -2.61 | ||||||
| Green | 1,599 | 4.51 | +0.80 | ||||||
| ACT | 1,245 | 3.51 | +2.29 | ||||||
| Māori | 325 | 0.92 | -0.23 | ||||||
| Progressive | 236 | 0.67 | -0.30 | ||||||
| Bill and Ben | 199 | 0.56 | |||||||
| Kiwi | 133 | 0.37 | |||||||
| Legalise Cannabis | 119 | 0.34 | +0.06 | ||||||
| Family Party | 61 | 0.17 | |||||||
| Democrats | 23 | 0.06 | +0.01 | ||||||
| Pacific | 22 | 0.06 | |||||||
| Alliance | 20 | 0.06 | +0.01 | ||||||
| Libertarianz | 13 | 0.04 | |||||||
| Workers Party | 6 | 0.02 | |||||||
| RONZ | 3 | 0.01 | |||||||
| RAM | 0 | 0.00 | |||||||
| Informal votes | 424 | 201 | |||||||
| Total Valid votes | 34,903 | 35,472 | |||||||
| Turnout | 35,937 | 80.15 | -0.09 | ||||||
| National gain from Labour | Majority | 6,445 | 18.47 | +22.90 | |||||
2005 election
| General election 2005: Taupo[8] | |||||||||
|---|---|---|---|---|---|---|---|---|---|
|
Notes: Green background denotes the winner of the electorate vote.
| |||||||||
| Party | Candidate | Votes | % | ±% | Party Votes | % | ±% | ||
| Labour | |
13,211 | 45.50 | -10.12 | 10,977 | 37.30 | -2.30 | ||
| National | Weston Kirton | 11,926 | 41.07 | +12.15 | 13,020 | 44.25 | +22.34 | ||
| NZ First | Kristin Campbell Smith | 1,337 | 4.60 | 2,281 | 7.75 | -5.59 | |||
| Green | John Davis | 751 | 2.59 | -2.50 | 1,093 | 3.71 | -1.68 | ||
| United Future | Paul Check | 598 | 2.06 | -1.20 | 769 | 2.61 | -2.99 | ||
| Māori | Billy Maea | 501 | 1.73 | 338 | 1.15 | ||||
| ACT | Andrew Jollands | 275 | 0.75 | -3.23 | 358 | 1.22 | -5.03 | ||
| Destiny | Charles Te Kowhai | 260 | 0.90 | 142 | 0.48 | ||||
| Progressive | David Reeks | 167 | 0.58 | -0.40 | 285 | 0.97 | -0.58 | ||
| RONZ | Debra Potroz | 11 | 0.04 | 2 | 0.01 | ||||
| Legalise Cannabis | 82 | 0.28 | -0.22 | ||||||
| Christian Heritage | 24 | 0.08 | |||||||
| Alliance | 15 | 0.05 | -5.49 | ||||||
| Democrats | 15 | 0.05 | |||||||
| Libertarianz | 12 | 0.04 | |||||||
| Family Rights | 5 | 0.02 | |||||||
| Direct Democracy | 4 | 0.01 | |||||||
| 99 MP | 2 | 0.01 | |||||||
| One NZ | 2 | 0.01 | -0.04 | ||||||
| Informal votes | 207 | 95 | |||||||
| Total Valid votes | 29,037 | 29,426 | |||||||
| Turnout | 29,722 | 80.24 | +4.48 | ||||||
| Labour hold | Majority | 1,285 | 4.43 | -22.27 | |||||
2002 election
| General election 2002: Taupo[9] | |||||||||
|---|---|---|---|---|---|---|---|---|---|
|
Notes: Green background denotes the winner of the electorate vote.
| |||||||||
| Party | Candidate | Votes | % | ±% | Party Votes | % | ±% | ||
| Labour | |
14,851 | 55.62 | +6.20 | 10,775 | 39.60 | +0.74 | ||
| National | Weston Kirton | 7,723 | 28.92 | -7.61 | 5,961 | 21.91 | -11.67 | ||
| Green | Nicholas Fisher | 1,359 | 5.09 | +1.50 | 1,467 | 5.39 | +0.37 | ||
| ACT | Diane Mulcock | 1,062 | 3.98 | +0.82 | 1,700 | 6.25 | -0.81 | ||
| United Future | Denis Gilmore | 871 | 3.26 | 1,523 | 5.60 | +3.99a | |||
| Christian Heritage | Donald Wishart | 360 | 1.35 | -0.74 | 292 | 1.07 | -0.80 | ||
| Progressive | Victor Bradley | 261 | 0.98 | 426 | 1.55 | ||||
| Alliance | John Harré | 214 | 0.80 | -1.52 | 193 | 0.73 | -4.81 | ||
| NZ First | 3,629 | 13.34 | +8.81 | ||||||
| ORNZ | 1,072 | 3.94 | |||||||
| Legalise Cannabis | 137 | 0.50 | -0.45 | ||||||
| Mana Māori | 19 | 0.07 | +0.01 | ||||||
| One NZ | 13 | 0.05 | -0.01 | ||||||
| NMP | 1 | 0.00 | -0.03 | ||||||
| Informal votes | 371 | 85 | |||||||
| Total Valid votes | 26,701 | 27,210 | |||||||
| Turnout | 27,538 | 75.76 | |||||||
| Labour hold | Majority | 7,128 | 26.70 | +13.81 | |||||
- a United Future swing is compared to the 1999 results of United NZ and Future NZ, who merged in 2000.
1999 election
| General election 1999: Taupo[10] | |||||||||
|---|---|---|---|---|---|---|---|---|---|
|
Notes: Green background denotes the winner of the electorate vote.
| |||||||||
| Party | Candidate | Votes | % | ±% | Party Votes | % | ±% | ||
| Labour | |
13,721 | 49.42 | 10,876 | 38.86 | ||||
| National | Davd Steele | 10,143 | 36.53 | 9,399 | 33.58 | ||||
| Green | Nick Fisher | 997 | 3.59 | 1,405 | 5.02 | ||||
| ACT | Richard Steele | 877 | 3.16 | 1,976 | 7.06 | ||||
| NZ First | Ross Honeyfield | 718 | 2.59 | 1,269 | 4.53 | ||||
| Alliance | Wayne Morris | 644 | 2.32 | 1,550 | 5.54 | ||||
| Christian Heritage | John van der Zee | 580 | 2.09 | 524 | 1.87 | ||||
| Mauri Pacific | Rovina Anderson | 51 | 0.18 | 20 | 0.71 | ||||
| Mana Wahine | Makere Rangitoheriri | 34 | 0.12 | ||||||
| Future NZ | 341 | 1.22 | |||||||
| Legalise Cannabis | 265 | 0.95 | |||||||
| Libertarianz | 111 | 0.40 | |||||||
| United NZ | 110 | 0.39 | |||||||
| McGillicuddy Serious | 41 | 0.15 | |||||||
| Animals First | 36 | 0.13 | |||||||
| One NZ | 17 | 0.06 | |||||||
| Mana Māori | 16 | 0.06 | |||||||
| Natural Law | 8 | 0.03 | |||||||
| NMP | 8 | 0.03 | |||||||
| Freedom Movement | 6 | 0.02 | |||||||
| People's Choice | 5 | 0.02 | |||||||
| Republican | 3 | 0.01 | |||||||
| South Island | 0 | 0.00 | |||||||
| Informal votes | 514 | 293 | |||||||
| Total Valid votes | 27,765 | 27,986 | |||||||
| Labour hold | Majority | 3,578 | 12.89 | ||||||
References
- ↑ Report of the Representation Commission 2007 (PDF). Representation Commission. 14 September 2007. p. 9. ISBN 978-0-477-10414-2. Retrieved 4 October 2014.
- ↑ Report of the Representation Commission 2014 (PDF). Representation Commission. 4 April 2014. p. 9. ISBN 978-0-477-10414-2. Retrieved 4 October 2014.
- ↑ "MP keen to get cracking". Waikato Times. 10 November 2008. Retrieved 10 October 2014.
- 1 2 "Official Count Results -- Taupō". Chief Electoral Office. 22 November 2008. Retrieved 10 October 2014.
- 1 2 3 "Official Count Results -- Taupō". Electoral Commission. 10 December 2014. Retrieved 4 December 2016.
- ↑ "Official Count Results -- Taupō". Electoral Commission. 10 October 2014. Retrieved 10 October 2014.
- ↑ "Enrolment statistics". Electoral Commission. 26 November 2011. Retrieved 27 November 2011.
- ↑ 2005 election results
- ↑ 2002 election results
- ↑ http://electionresults.org.nz/electionresults_1999/e9/html/e9_partIV.html
External links
- Electorate Profile Parliamentary Library