U.S. Standard Atmosphere
The U.S. Standard Atmosphere is an atmospheric model of how the pressure, temperature, density, and viscosity of the Earth's atmosphere change over a wide range of altitudes or elevations. The model, based on an existing international standard, was first published in 1958 by the U.S. Committee on Extension to the Standard Atmosphere, and was updated in 1962, 1966, and 1976. It is largely consistent in methodology with the International Standard Atmosphere, differing mainly in the assumed temperature distribution at higher altitudes.
Methodology
The USSA mathematical model divides the atmosphere into layers with an assumed linear distribution of absolute temperature T against geopotential altitude h.[2] The other two values (pressure P and density ρ) are computed by simultaneously solving the equations resulting from:
- the vertical pressure variation, which relates pressure, density and geopotential altitude (using a standard pressure of 101,325 pascals (14.696 psi) at mean sea level as a boundary condition):
- , and

- the ideal gas law in molar form, which relates pressure, density, and temperature:

at each geopotential altitude. g is the acceleration of gravity, and Rspecific is the specific gas constant for dry air.
Air density must be calculated in order to solve for the pressure, and is used in calculating dynamic pressure for moving vehicles. Dynamic viscosity is an empirical function of temperature, and kinematic viscosity is calculated by dividing dynamic viscosity by the density.
Thus the standard consists of a tabulation of values at various altitudes, plus some formulas by which those values were derived.
To allow modeling conditions below mean sea level, the troposphere is actually extended to −2,000 feet (−610 m), where the temperature is 66.1 °F (18.9 °C), pressure is 15.79 pounds per square inch (108,900 Pa), and density is 0.08106 pounds per cubic foot (1.2985 kg/m3).
1962 version
The basic assumptions made for the 1962 version were:[3]
- air is a clean, dry, perfect gas mixture (cp/cv = 1.40)
- molecular weight to 90 km of 28.9644 (C-12 scale)
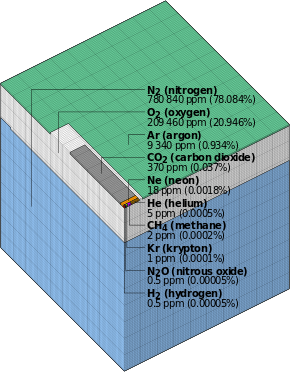
- principal sea-level constituents are assumed to be:
- assigned mean conditions at sea level are as follows :
1976 version
This is the most recent version and differs from previous versions only above 32 km:
| Subscript b | Geopotential altitude above MSL[4] |
Static pressure | Standard temperature (K) |
Temperature Lapse Rate | |||
|---|---|---|---|---|---|---|---|
| (m) | (ft) | (pascals) | (inHg) | (K/m) | (K/ft) | ||
| 0 | 0 | 0 | 101325 | 29.92126 | 288.15 | -0.0065 | -0.0019812 |
| 1 | 11,000 | 36,089 | 22632.1 | 6.683245 | 216.65 | 0.0 | 0.0 |
| 2 | 20,000 | 65,617 | 5474.89 | 1.616734 | 216.65 | 0.001 | 0.0003048 |
| 3 | 32,000 | 104,987 | 868.019 | 0.2563258 | 228.65 | 0.0028 | 0.00085344 |
| 4 | 47,000 | 154,199 | 110.906 | 0.0327506 | 270.65 | 0.0 | 0.0 |
| 5 | 51,000 | 167,323 | 66.9389 | 0.01976704 | 270.65 | -0.0028 | -0.00085344 |
| 6 | 71,000 | 232,940 | 3.95642 | 0.00116833 | 214.65 | -0.002 | -0.0006096 |

See also
Notes
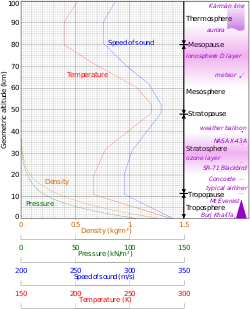
- ↑ Geometric altitude vs. temperature, pressure, density, and the speed of sound derived from the 1962 U.S. Standard Atmosphere.
- ↑ Gyatt, Graham (2006-01-14): "The Standard Atmosphere". A mathematical model of the 1976 U.S. Standard Atmosphere.
- ↑ Tuve, George Lewis; Bolz, Ray E. (1973). CRC handbook of tables for applied engineering science. Boca Raton: CRC Press. ISBN 0-8493-0252-8.
- ↑ U.S. Standard Atmosphere, 1962, U.S. Government Printing Office, Washington, D.C., 1962
References
- U.S. Extension to the ICAO Standard Atmosphere, U.S. Government Printing Office, Washington, D.C., 1958.
- U.S. Standard Atmosphere, 1962, U.S. Government Printing Office, Washington, D.C., 1962.
- U.S. Standard Atmosphere Supplements, 1966, U.S. Government Printing Office, Washington, D.C., 1966.
- U.S. Standard Atmosphere, 1976, U.S. Government Printing Office, Washington, D.C., 1976 (Linked file is 17 MB).
External links
- NASA GSFC ModelWeb
- A mathematical model of the 1976 U.S. Standard Atmosphere
- Online 1976 US Standard Atmosphere calculator and table generator
- Calculate 28 properties of 1976 Standard Atmosphere