United States presidential election in Michigan, 2004
| | ||||||||||||||||||||||||||||||||
| ||||||||||||||||||||||||||||||||
| ||||||||||||||||||||||||||||||||
|
| ||||||||||||||||||||||||||||||||
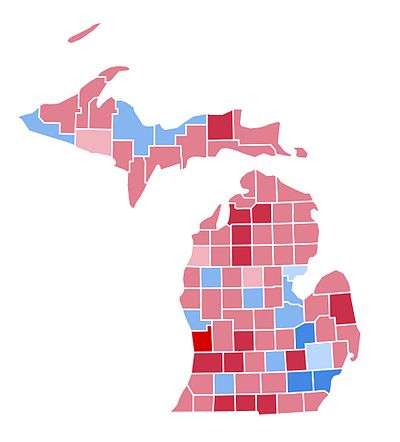
| County Results
Kerry—60-70%
Kerry—50-60%
Kerry—<50%
Bush—<50%
Bush—50-60%
Bush—60-70%
Bush—70-80% | ||||||||||||||||||||||||||||||||
| ||||||||||||||||||||||||||||||||

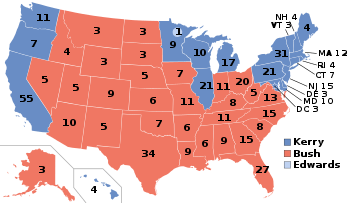
The 2004 United States presidential election in Michigan took place on November 2, 2004 throughout all 50 states and D.C., which was part of the 2004 United States presidential election. Voters chose 17 representatives, or electors to the Electoral College, who voted for President and Vice President.
Michigan was won by Democrat nominee John Kerry by a 3.4% margin of victory. Although no Republican carried this state in a presidential election since 1988, early polling showed the race was a toss-up, thus was considered as a possible target for the Republicans. Later polling favored Kerry, leading half of the news organizations predicted Kerry would win the state, but the other half still considered it a swing state.
Caucuses
Campaign
| Elections in Michigan | ||||||||||
|---|---|---|---|---|---|---|---|---|---|---|
 | ||||||||||
|
||||||||||
Predictions
There were 12 news organizations who made state by state predictions of the election. Here are their last predictions before election day.[1]
- D.C. Political Report: Slight Democrat
- Associated Press: Toss-Up
- CNN: Kerry
- Cook Political Report: Lean Democrat
- Newsweek: Leans Kerry
- New York Times: Leans Kerry
- Rasmussen Reports: Toss-Up
- Research 2000: Lean Kerry
- Washington Post: Battleground
- Washington Times: Leans Kerry
- Zogby International: Kerry
- Washington Dispatch: Kerry
Polling
Pre-election polling did show a close race early on, but in the fall election Kerry pulled away and won every poll since the month of September. The last 3 poll average showed Kerry leading 49% to 46%.[2]
Fundraising
Bush raised $4,960,010.[3] Kerry raised $2,496,203.[4]
Advertising and visits
In the fall campaign, Bush visited the state 10 times. Kerry visited 7 visits. Both candidates combined spent over $2 million in advertising each week,[5] but Kerry spent slightly more each week.[6]
Analysis
The state has competitive suburban counties with a large Roman Catholic population. Kerry won this state with 51%. George W. Bush performed moderately well, but below potential, in the state winning a majority of the counties and congressional districts and performing moderately well, but below potential in suburban counties of Oakland and Macomb. Bush's lack of attention to economic issues important to Michigan voters may have been a reason for Kerry's win. Kerry won 70% of Wayne County, Detroit. Both Ronald Reagan and George H.W. Bush won the state of Michigan.
Results
| United States presidential election in Michigan, 2004 | |||||
|---|---|---|---|---|---|
| Party | Candidate | Votes | Percentage | Electoral votes | |
| Democratic | John Kerry | 2,479,183 | 51.3% | 17 | |
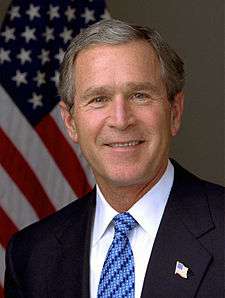
| Republican | George W. Bush (incumbent) | 2,313,746 | 47.8% | 0 | |
| Independent | Ralph Nader | 24,035 | 0.5% | 0 | |
| Libertarian | Michael Badnarik | 10,552 | 0.2% | 0 | |
| Green | David Cobb | 5,325 | 0.1% | 0 | |
| US Taxpayers | Michael Peroutka | 4,980 | 0.1% | 0 | |
| Natural Law | Walt Brown | 1,431 | 0.0% | 0 | |
| Totals | 4,839,252 | 100.00% | 17 | ||
| Voter turnout (Voting Age Population) | 64.2% | ||||
Results breakdown
By county
| County | Bush | Kerry |
| Alcona County | 3,592 | 2,871 |
| Alger County | 2,318 | 2,395 |
| Allegan County | 34,022 | 19,355 |
| Alpena County | 7,665 | 7,407 |
| Antrim County | 8,379 | 5,072 |
| Arenac County | 4,071 | 4,076 |
| Baraga County | 1,977 | 1,660 |
| Barry County | 18,638 | 11,312 |
| Bay County | 25,448 | 31,049 |
| Benzie County | 5,284 | 4,383 |
| Berrien County | 41,076 | 32,846 |
| Branch County | 10,784 | 7,004 |
| Calhoun County | 32,093 | 29,891 |
| Cass County | 12,964 | 9,537 |
| Charlevoix County | 8,214 | 5,729 |
| Cheboygan County | 7,798 | 5,941 |
| Chippewa County | 9,122 | 7,203 |
| Clare County | 7,088 | 6,984 |
| Clinton County | 21,989 | 15,483 |
| Crawford County | 4,017 | 3,126 |
| Delta County | 9,680 | 9,381 |
| Dickinson County | 7,734 | 5,650 |
| Eaton County | 29,781 | 25,411 |
| Emmet County | 10,332 | 6,846 |
| Genesee County | 83,870 | 128,334 |
| Gladwin County | 6,770 | 6,343 |
| Gogebic County | 3,935 | 4,421 |
| Grand Traverse County | 27,446 | 18,256 |
| Gratiot County | 9,834 | 7,377 |
| Hillsdale County | 12,804 | 7,123 |
| Houghton County | 8,889 | 6,731 |
| Huron County | 9,671 | 7,629 |
| Ingham County | 54,734 | 76,877 |
| Ionia County | 16,621 | 10,647 |
| Iosco County | 7,301 | 6,557 |
| Iron County | 3,224 | 3,215 |
| Isabella County | 11,754 | 12,334 |
| Jackson County | 40,029 | 31,025 |
| Kalamazoo County | 57,147 | 61,462 |
| Kalkaska County | 5,084 | 3,189 |
| Kent County | 171,201 | 116,909 |
| Keweenaw County | 781 | 630 |
| Lake County | 2,503 | 2,675 |
| Lapeer County | 25,556 | 18,086 |
| Leelanau County | 7,733 | 6,048 |
| Lenawee County | 25,675 | 20,787 |
| Livingston County | 58,860 | 33,991 |
| Luce County | 1,749 | 1,045 |
| Mackinac County | 3,706 | 2,819 |
| Macomb County | 202,166 | 196,160 |
| Manistee County | 6,295 | 6,272 |
| Marquette County | 14,690 | 17,412 |
| Mason County | 8,124 | 6,333 |
| Mecosta County | 9,710 | 7,730 |
| Menominee County | 5,942 | 5,326 |
| Midland County | 24,369 | 18,355 |
| Missaukee County | 5,055 | 2,319 |
| Monroe County | 37,470 | 36,089 |
| Montcalm County | 14,968 | 11,471 |
| Montmorency County | 3,300 | 2,196 |
| Muskegon County | 35,302 | 44,282 |
| Newaygo County | 13,608 | 9,057 |
| Oakland County | 316,633 | 319,387 |
| Oceana County | 6,677 | 5,441 |
| Ogemaw County | 5,454 | 5,215 |
| Ontonagon County | 2,262 | 1,863 |
| Osceola County | 6,599 | 4,467 |
| Oscoda County | 2,570 | 1,792 |
| Otsego County | 7,470 | 4,674 |
| Ottawa County | 92,048 | 35,552 |
| Presque Isle County | 3,982 | 3,432 |
| Roscommon County | 7,364 | 6,810 |
| Saginaw County | 47,165 | 54,887 |
| St. Clair County | 42,740 | 36,174 |
| St. Joseph County | 15,340 | 9,648 |
| Sanilac County | 12,632 | 7,883 |
| Schoolcraft County | 2,267 | 2,137 |
| Shiawassee County | 19,407 | 16,881 |
| Tuscola County | 15,389 | 12,631 |
| Van Buren County | 17,634 | 16,151 |
| Washtenaw County | 61,455 | 109,953 |
| Wayne County | 257,750 | 600,047 |
| Wexford County | 8,966 | 6,034 |
By congressional district
Bush won 10 of 15 congressional districts.[7]
| District | Bush | Kerry | Representative |
|---|---|---|---|
| 1st | 53% | 46% | Bart Stupak |
| 2nd | 60% | 39% | Peter Hoekstra |
| 3rd | 59% | 40% | Vern Ehlers |
| 4th | 55% | 44% | Dave Camp |
| 5th | 41% | 59% | Dale Kildee |
| 6th | 53% | 46% | Fred Upton |
| 7th | 54% | 45% | Nick Smith |
| Joe Schwarz | |||
| 8th | 54% | 45% | Mike Rogers |
| 9th | 51% | 49% | Joe Knollenberg |
| 10th | 57% | 43% | Candice Miller |
| 11th | 53% | 47% | Thaddeus McCotter |
| 12th | 39% | 61% | Sander Levin |
| 13th | 19% | 81% | Carolyn Cheeks Kilpatrick |
| 14th | 17% | 83% | John Conyers Jr. |
| 15th | 38% | 62% | John Dingell |
Electors
Technically the voters of Michigan cast their ballots for electors: representatives to the Electoral College. Michigan is allocated 17 electors because it has 15 congressional districts and 2 senators. All candidates who appear on the ballot or qualify to receive write-in votes must submit a list of 17 electors, who pledge to vote for their candidate and his or her running mate. Whoever wins the majority of votes in the state is awarded all 17 electoral votes. Their chosen electors then vote for President and Vice President. Although electors are pledged to their candidate and running mate, they are not obligated to vote for them. An elector who votes for someone other than his or her candidate is known as a faithless elector.
The electors of each state and the District of Columbia met on December 13, 2004 to cast their votes for President and Vice President. The Electoral College itself never meets as one body. Instead the electors from each state and the District of Columbia met in their respective capitols.
The following were the members of the Electoral College from the state. All 17 were pledged for Kerry/Edwards:
- Carol Vining Moore
- Margaret Robinson
- Ida I. DeHaas
- Marcela L. Ort
- Vickie Sue Price
- Paul Todd
- Leonard Smigielski
- Bruce McAttee
- Stanley W. Harris
- Yvonne Williams
- Elizabeth D. Tavarozzi
- Charley Jackson
- Joan Robinson Cheeks
- Roger Short
- Harless Scott
- Richard Shoemaker
- Michael Pitt
References
- ↑ http://www.dcpoliticalreport.com/members/2004/Pred2.htm#NW[]
- ↑ http://uselectionatlas.org/USPRESIDENT/GENERAL/CAMPAIGN/2004/polls.php?fips=26
- ↑ http://www.campaignmoney.com/political/campaigns/george_w_bush.asp?cycle=04
- ↑ http://www.campaignmoney.com/political/campaigns/john_f_kerry.asp?cycle=04
- ↑ http://www.cnn.com/ELECTION/2004/special/president/campaign.ads/
- ↑ http://www.cnn.com/ELECTION/2004/special/president/showdown/MI/
- ↑ http://www.swingstateproject.com/diary/4161/