Vancouver municipal election, 2011
| | |||||||||||||||||||||||||||||||||||||||||||||||||||||||||||||||||||||||||||||||||||||||||||||||||||
| |||||||||||||||||||||||||||||||||||||||||||||||||||||||||||||||||||||||||||||||||||||||||||||||||||
| |||||||||||||||||||||||||||||||||||||||||||||||||||||||||||||||||||||||||||||||||||||||||||||||||||
| |||||||||||||||||||||||||||||||||||||||||||||||||||||||||||||||||||||||||||||||||||||||||||||||||||
.jpg)
The City of Vancouver held its municipal election on November 19, 2011, along with other municipalities and regional districts in British Columbia. All local government elections were for a three-year period. The ballot elected one Mayor, 10 councillors, nine school board trustees and seven park board commissioners. A $180 million capital borrowing plan[1] was also put to a vote.
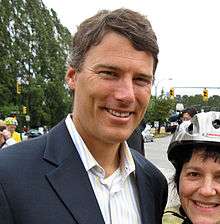
Incumbent Mayor Gregor Robertson and the Vision Vancouver Party sought and won their second term in office following their victory in the 2008 election. All Vision Vancouver candidates won seats in their respective categories.[2]
Suzanne Anton lost her bid as mayor but the NPA team gained seats in council, Park Board and School Board. COPE was nearly wiped out this election, losing both seats in city council. Its only elected official was School Board trustee incumbent Allan Wong.[3] On December 8, 2013, Wong resigned from COPE and joined Vision as a sitting trustee.
The Green Party of Vancouver had its first elected city councillor with Adriane Carr, but lost its incumbent seat in the Park Board.[4] New party NSV did not win any seats in council. Leader Randy Helten placed a distant third in the mayoral race.
Candidates and results
The nomination period officially opened on October 4, 2011 and closed on October 14, 2011. This was the second election where Vision Vancouver and the Coalition of Progressive Electors (COPE) signed an electoral agreement to support each other's candidates for election.[5][6] (I) denotes incumbents.
Mayor
Twelve candidates sought election to the position of mayor. Four were affiliated with a political party and eight were independents. Incumbent mayor Gregor Robertson of Vision Vancouver was re-elected.
| Candidate Name | Party affiliation | Votes | % of votes | Elected | |
|---|---|---|---|---|---|
| (I) Robertson, GregorGregor Robertson | Vision Vancouver | 77,005 | 53.17% | X | |
| Anton, SuzanneSuzanne Anton | Non-Partisan Association | 58,152 | 40.15% | ||
| Helten, RandyRandy Helten | Neighbourhoods for a Sustainable Vancouver | 4,007 | 2.77% | ||
| McGuire, GerryGerry McGuire | Vancouver Citizen's Voice | 1,195 | 0.83% | ||
| Pelletier, SamSam Pelletier | Independent | 443 | 0.31% | ||
| Zimmerman, DarrellDarrell Zimmerman | Independent | 426 | 0.29% | ||
| Dubgee | Independent | 419 | 0.29% | ||
| Lawrance, RobinRobin Lawrance | Independent | 353 | 0.24% | ||
| Paquette, Victor B.Victor B. Paquette | Independent | 333 | 0.23% | ||
| Cooke, Lloyd AlanLloyd Alan Cooke | Independent | 310 | 0.21% | ||
| Caissy, MenardMenard Caissy | Independent | 288 | 0.20% | ||
| Buday, Gölök ZoltánGölök Zoltán Buday | Independent | 268 | 0.19% |
City Councillors
Ten councillors were elected out of these 41 candidates. Of them, 28 were affiliated with a political party, and 13 were independent. Seven incumbent councillors sought re-election: six from Vision Vancouver and one from COPE. Of those subsequently elected, Vision Vancouver held seven seats, the NPA two and the Green Party of Vancouver one.
| Candidate Name | Party Affiliation | Votes | % of Votes | Elected | |
|---|---|---|---|---|---|
| (I) Louie, RaymondRaymond Louie | Vision Vancouver | 63,273 | 43.69% | X | |
| (I) Jang, KerryKerry Jang | Vision Vancouver | 61,931 | 42.76% | X | |
| (I) Deal, HeatherHeather Deal | Vision Vancouver | 61,368 | 42.37% | X | |
| (I) Reimer, AndreaAndrea Reimer | Vision Vancouver | 60,593 | 41.84% | X | |
| (I) Stevenson, TimTim Stevenson | Vision Vancouver | 56,638 | 39.11% | X | |
| (I) Meggs, GeoffGeoff Meggs | Vision Vancouver | 56,184 | 38.79% | X | |
| Tang, TonyTony Tang | Vision Vancouver | 53,873 | 37.20% | X | |
| Ball, ElizabethElizabeth Ball | Non-Partisan Association | 51,607 | 35.63% | X | |
| Affleck, GeorgeGeorge Affleck | Non-Partisan Association | 51,145 | 35.32% | X | |
| Carr, AdrianeAdriane Carr | Green Party of Vancouver | 48,648 | 33.59% | X | |
| (I) Woodsworth, EllenEllen Woodsworth | Coalition of Progressive Electors | 48,557 | 33.53% | ||
| Yuen, BillBill Yuen | Non-Partisan Association | 48,407 | 33.42% | ||
| Klassen, MikeMike Klassen | Non-Partisan Association | 47,868 | 33.05% | ||
| Charko, KenKen Charko | Non-Partisan Association | 45,373 | 31.33% | ||
| McCreery, BillBill McCreery | Non-Partisan Association | 45,114 | 31.15% | ||
| Wong, FrancisFrancis Wong | Non-Partisan Association | 44,707 | 30.87% | ||
| Louis, TimTim Louis | Coalition of Progressive Electors | 43,926 | 30.33% | ||
| Bickerton, SeanSean Bickerton | Non-Partisan Association | 43,289 | 29.89% | ||
| Carangi, JoeJoe Carangi | Non-Partisan Association | 41,460 | 28.63% | ||
| Aquino, RJRJ Aquino | Coalition of Progressive Electors | 39,054 | 26.97% | ||
| Lamarche, JasonJason Lamarche | Non-Partisan Association | 37,286 | 25.75% | ||
| Garossino, SandySandy Garossino | Independent | 20,866 | 14.41% | ||
| Murphy, ElizabethElizabeth Murphy | Neighbourhoods for a Sustainable Vancouver | 19,644 | 13.56% | ||
| Benson, NicoleNicole Benson | Neighbourhoods for a Sustainable Vancouver | 17,983 | 12.42% | ||
| Martin, TerryTerry Martin | Neighbourhoods for a Sustainable Vancouver | 13,025 | 8.99% | ||
| Kerchum, MarieMarie Kerchum | Neighbourhoods for a Sustainable Vancouver | 12,614 | 8.71% | ||
| Shaw, ChrisChris Shaw | De-Growth Vancouver | 8,219 | 5.68% | ||
| Gregson, IanIan Gregson | De-Growth Vancouver | 7,872 | 5.44% | ||
| Fox, AmyAmy Fox | Independent | 6,499 | 4.49% | ||
| Alm, KellyKelly Alm | Independent | 5,525 | 3.82% | ||
| Fraser, GrantGrant Fraser | Independent | 4,758 | 3.29% | ||
| Masson, ChrisChris Masson | De-Growth Vancouver | 4,690 | 3.24% | ||
| Gill, Lauren R.I.C.H.Lauren R.I.C.H. Gill | Independent | 4,682 | 3.23% | ||
| Dharni, Michael SinghMichael Singh Dharni | Independent | 4,167 | 2.88% | ||
| Nguyen, Marc TanMarc Tan Nguyen | Independent | 4,118 | 2.84% | ||
| Orser, RickRick Orser | Independent | 3,996 | 2.76% | ||
| Wendythirteen | Independent | 3,926 | 2.71% | ||
| Nguyen, BangBang Nguyen | Independent | 3,826 | 2.64% | ||
| Copeland, Cord (Ted)Cord (Ted) Copeland | Independent | 3,587 | 2.48% | ||
| Spires, Aaaron R.I.C.H.Aaaron R.I.C.H. Spires | Independent | 2,200 | 1.52% | ||
| Maxwell N Bur, R HR H Maxwell N Bur | Independent | 1,955 | 1.35% |
Park Commissioners
Seven commissioners were elected out of 21 candidates. Of them, 15 were affiliated with a political party, and six were independent. Four incumbent commissioners sought re-election: three from Vision Vancouver and one from the Green Party of Vancouver. Of the elected commissioners, Vision held five seats and the NPA two.
| Candidate Name | Party Affiliation | Votes | % of Votes | Elected | |
|---|---|---|---|---|---|
| (I) Barnes, ConstanceConstance Barnes | Vision Vancouver | 63,952 | 44.16% | X | |
| (I) Blyth, SarahSarah Blyth | Vision Vancouver | 62,198 | 42.95% | X | |
| (I) Jasper, AaronAaron Jasper | Vision Vancouver | 58,343 | 40.29% | X | |
| Sharma, NikiNiki Sharma | Vision Vancouver | 58,330 | 40.28% | X | |
| De Genova, MelissaMelissa De Genova | Non-Partisan Association | 56,501 | 39.01% | X | |
| Coupar, JohnJohn Coupar | Non-Partisan Association | 50,375 | 34.78% | X | |
| Loke, TrevorTrevor Loke | Vision Vancouver | 49,878 | 34.44% | X | |
| Crawford, CaseyCasey Crawford | Non-Partisan Association | 49,020 | 33.85% | ||
| Kalaw, GabbyGabby Kalaw | Non-Partisan Association | 48,600 | 33.56% | ||
| Upton, JasonJason Upton | Non-Partisan Association | 46,261 | 31.94% | ||
| Pasin, DaveDave Pasin | Non-Partisan Association | 46,005 | 31.77% | ||
| (I) Mackinnon, StuartStuart Mackinnon | Green Party of Vancouver | 44,761 | 30.91% | ||
| Granby, BrentBrent Granby | Coalition of Progressive Electors | 42,769 | 29.53% | ||
| Greenwell-Baker, DonaldaDonalda Greenwell-Baker | Coalition of Progressive Electors | 39,033 | 26.95% | ||
| Hamilton, Jamie LeeJamie Lee Hamilton | Independent Democratic Electoral Alliance | 19,495 | 13.46% | ||
| Andalis, Juliet VictoriaJuliet Victoria Andalis | Independent | 12,693 | 8.76% | ||
| Hadley, EleanorEleanor Hadley | Independent | 10,754 | 9.37% | ||
| Murray, AndrewAndrew Murray | Independent | 9,819 | 6.78% | ||
| Truong, TammyTammy Truong | Independent | 8,917 | 6.16% | ||
| Haskell, Peter RaymondPeter Raymond Haskell | Independent | 5,540 | 3.83% | ||
| Pri Toor, FreyjaFreyja Pri Toor | Independent | 5,062 | 3.50% |
School Trustees
Nine school trustees were elected out of these 20 candidates. Of them, 15 are affiliated with a political party, and five are independent. Seven incumbent trustees are seeking re-election: three from Vision Vancouver, three from COPE, and one from NPA. Of the elected trustees, five are from Vision Vancouver, three from NPA and one from COPE.
| Candidate Name | Party Affiliation | Votes | % of Votes | Elected | |
|---|---|---|---|---|---|
| (I) Bacchus, PattiPatti Bacchus | Vision Vancouver | 72,025 | 49.73% | X | |
| (I) Lombardi, MikeMike Lombardi | Vision Vancouver | 65,411 | 45.17% | X | |
| (I) Clement, KenKen Clement | Vision Vancouver | 61,994 | 42.81% | X | |
| Payne, CherieCherie Payne | Vision Vancouver | 61,874 | 42.72% | X | |
| (I) Denike, KenKen Denike | Non-Partisan Association | 59,310 | 40.95% | X | |
| (I) Wong, AllanAllan Wong | Coalition of Progressive Electors | 57,902 | 39.98% | X | |
| Wynen, RobRob Wynen | Vision Vancouver | 56,763 | 39.19% | X | |
| Woo, SophiaSophia Woo | Non-Partisan Association | 55,890 | 38.59% | X | |
| Ballantyne, FraserFraser Ballantyne | Non-Partisan Association | 55,713 | 38.47% | X | |
| Robertson, StacyStacy Robertson | Non-Partisan Association | 54,275 | 37.48% | ||
| Giesbrecht, GwenGwen Giesbrecht | Coalition of Progressive Electors | 52,470 | 36.23% | ||
| (I) Bouey, JaneJane Bouey | Coalition of Progressive Electors | 52,026 | 35.92% | ||
| (I) Blakey, AlAl Blakey | Coalition of Progressive Electors | 51,963 | 35.88% | ||
| Sharma, SandySandy Sharma | Non-Partisan Association | 49,843 | 34.42% | ||
| Boutin, LouiseLouise Boutin | Green Party of Vancouver | 34,477 | 23.81% | ||
| Harvey, LilyLily Harvey | Independent | 20,314 | 14.03% | ||
| Lauenstein, MishaMisha Lauenstein | Independent | 14,297 | 9.87% | ||
| Stark, Robert AllanRobert Allan Stark | Independent | 13,391 | 9.25% | ||
| Nguyen, BangBang Nguyen | Independent | 12,903 | 8.91% | ||
| Haskell, Peter RaymondPeter Raymond Haskell | Independent | 11,915 | 8.23% |
Capital Plan Questions
1. Are you in favour of Council having the authority, without further assent of the electors, to pass by-laws between January 1, 2012 and December 31, 2014 to borrow an aggregate $65,800,000 for the following purposes?
- Community Facilities at $58,600,000
- Parks at $7,200,000
| Option | Votes | Percentage |
|---|---|---|
| Yes | 81,605 | 63.39% |
| No | 47,124 | 36.61% |
| Total Votes | 128,729 | 100% |
2. Are you in favour of Council having the authority, without further assent of the electors, to pass by-laws between January 1, 2012 and December 31, 2014 to borrow an aggregate $66,300,000 for the following purposes?
- Street and Bridge Infrastructure at $41,150,000
- Transit and Safety Improvements at $8,500,000
- Street Lighting, Traffic Signals and Communications Systems at $16,650,000
| Option | Votes | Percentage |
|---|---|---|
| Yes | 88,640 | 68.85% |
| No | 40,095 | 31.15% |
| Total Votes | 128,735 | 100% |
3. Are you in favour of Council having the authority, without further assent of the electors, to pass by-laws between January 1, 2012 and December 31, 2014 to borrow an aggregate $47,700,000 for the following purposes?
- Public Safety Facilities at $13,200,000
- Civic Facilities at $34,500,000
| Option | Votes | Percentage |
|---|---|---|
| Yes | 87,515 | 68.23% |
| No | 40,740 | 31.76% |
| Total Votes | 128,255 | 100% |
Voter and party statistics
Voter turnout
Of the 418,878 registered voters, there were 144,823 recorded ballots, marking the voter turnout at 34.57%.[7] This is an increase from the 30.79% turnout during the previous municipal election in 2008.
Elected percentage by party
Of the parties represented, only Vision Vancouver had its entire slate of candidates elected in all fields.
| Party | Mayor | Councillors | Park Commissioners | School Trustees | Total candidates | ||||||
|---|---|---|---|---|---|---|---|---|---|---|---|
| # Elected | % Elected | # Elected | % Elected | # Elected | % Elected | # Elected | % Elected | # Elected | % Elected | ||
| Vision Vancouver | 1/1 | 100.0% | 7/7 | 100.0% | 5/5 | 100.0% | 5/5 | 100.0% | 18/18 | 100.0% | |
| Green Party of Vancouver | NIL | N/A | 1/1 | 100.0% | 0/1 | 0.0% | 0/1 | 0.0% | 1/3 | 33.3% | |
| Non-Partisan Association | 0/1 | 0.0% | 2/10 | 20.0% | 2/6 | 33.3% | 3/5 | 60.0% | 7/22 | 31.8% | |
| Coalition of Progressive Electors | NIL | N/A | 0/3 | 0.0% | 0/2 | 0.0% | 1/4 | 25.0% | 1/9 | 11.1% | |
| Neighbourhoods for a Sustainable Vancouver | 0/1 | 0.0% | 0/4 | 0.0% | NIL | N/A | NIL | N/A | 0/5 | 0.0% | |
| De-Growth Vancouver | NIL | N/A | 0/3 | 0.0% | NIL | N/A | NIL | N/A | 0/3 | 0.0% | |
| Vancouver Citizen's Voice | 0/1 | 0.0% | NIL | N/A | NIL | N/A | NIL | N/A | 0/1 | 0.0% | |
| Independent Democratic Electoral Alliance | NIL | N/A | NIL | N/A | 0/1 | 0.0% | NIL | N/A | 0/1 | 0.0% | |
| Independent candidates | 0/8 | 0.0% | 0/13 | 0.0% | 0/6 | 0.0% | 0/5 | 0.0% | 0/32 | 0.0% | |
Seat changes by party
| Party | Mayor & Councillors | Park Commissioners | School Trustees | Total elected | |||||||||||||
|---|---|---|---|---|---|---|---|---|---|---|---|---|---|---|---|---|---|
| 2008 | 2011 | % Change | % Seats | 2008 | 2011 | % Change | % Seats | 2008 | 2011 | % Change | % Seats | 2008 | 2011 | % Change | % Seats | ||
| Vision Vancouver | 8 | 8 | ±0.00% | 72.73% | 4 | 5 | +25.00% | 71.43% | 4 | 5 | +25.00% | 55.56% | 16 | 18 | +12.50% | 66.67% | |
| Non-Partisan Association | 1 | 2 | +100.00% | 18.18% | 1 | 2 | +100.00% | 28.57% | 2 | 3 | +50.00% | 33.33% | 4 | 7 | +75.00% | 25.93% | |
| Green Party of Vancouver | 0 | 1 | N/A | 9.09% | 1 | 0 | -100.00% | 0.00% | 0 | 0 | ±0.00% | 0.00% | 1 | 1 | ±0.00% | 3.70% | |
| Coalition of Progressive Electors | 2 | 0 | -100.00% | 0.00% | 1 | 0 | -100.00% | 0.00% | 3 | 1 | -66.67% | 11.11% | 6 | 1 | -83.33% | 3.70% | |
References
- ↑ Capital Plan 2012-2014 at vancouver.ca
- ↑ Spencer, Kent; Olivier, Cassidy (November 20, 2011). "Robertson leads Vision sweep". The Province. Retrieved November 23, 2011.
- ↑ O'Connor, Naoibh (November 21, 2011). "COPE's last man standing speaks". Vancouver Courier. Retrieved November 23, 2011.
- ↑ Thomas, Sandra (November 19, 2011). "Adriane Carr makes Vancouver city council history". Vancouver Courier. Retrieved November 23, 2011.
- ↑ Howell, Mike (November 21, 2011). "COPE infighting follows Vancouver election disaster". Vancouver Courier. Retrieved November 23, 2011.
- ↑ Carrigg, David (November 20, 2011). "Veteran left-wing COPE squeezed out of picture". The Province. Retrieved November 23, 2011.
- ↑ Percent Voter Turnout Calculations for BC Municipalities CivicInfo BC. Retrieved 2011-11-20
External links
- Vancouver Votes on city website