Vertical line test
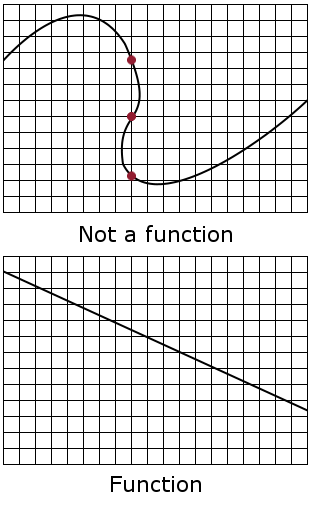
In mathematics, the vertical line test is a visual way to determine if a curve is a graph of a function or not. A function can only have one output, y, for each unique input, x. If a vertical line intersects a curve on an xy-plane more than once then for one value of x the curve has more than one value of y, and so, the curve does not represent a function. If all vertical lines intersect a curve at most once then the curve represents a function.[1]
To use the vertical line test, take a ruler or other straight edge and draw a line parallel to the y-axis for any chosen value of x. If the vertical line you drew intersects the graph more than once for any value of x then the graph is not the graph of a function. If, alternatively, a vertical line intersects the graph no more than once, no matter where the vertical line is placed, then the graph is the graph of a function. For example, a curve which is any straight line other than a vertical line will be the graph of a function. As another example, a sideways parabola (one whose directrix is a vertical line) is not the graph of a function because some vertical lines will intersect the parabola twice.