1.96
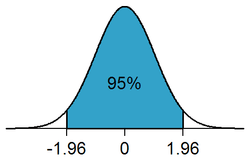
1.96 is the approximate value of the 97.5 percentile point of the normal distribution used in probability and statistics. 95% of the area under a normal curve lies within roughly 1.96 standard deviations of the mean, and due to the central limit theorem, this number is therefore used in the construction of approximate 95% confidence intervals. Its ubiquity is due to the arbitrary but common convention of using confidence intervals with 95% coverage rather than other coverages (such as 90% or 99%).[1][2][3][4] This convention seems particularly common in medical statistics,[5][6][7] but is also common in other areas of application, such as earth sciences,[8] social sciences and business research.[9]
There is no single accepted name for this number; it is also commonly referred to as the "standard normal deviate", "normal score" or "Z score" for the 97.5 percentile point, or .975 point.
If X has a standard normal distribution, i.e. X ~ N(0,1),


and as the normal distribution is symmetric,

One notation for this number is z.025.[10] From the probability density function of the normal distribution, the exact value of z.025 is determined by

History

The use of this number in applied statistics can be traced to the influence of Ronald Fisher's classic textbook, Statistical Methods for Research Workers, first published in 1925:
"The value for which P = .05, or 1 in 20, is 1.96 or nearly 2 ; it is convenient to take this point as a limit in judging whether a deviation is to be considered significant or not."[11]
In Table 1 of the same work, he gave the more precise value 1.959964.[12] In 1970, the value truncated to 20 decimal places was calculated to be
- 1.95996 39845 40054 23552...[13]
The commonly used approximate value of 1.96 is therefore accurate to better than one part in 50,000, which is more than adequate for applied work.
Software functions
The inverse of the standard normal CDF can be used to compute the value. The following is a table of function calls that return 1.96 in some commonly used applications:
| Application | Function call |
|---|---|
| Excel | NORM.S.INV(0.975) |
| MATLAB | norminv(0.975) |
| R | qnorm(0.975) |
| scipy | scipy.stats.norm.ppf(0.975) |
| SPSS | x = COMPUTE IDF.NORMAL(0.975,0,1). |
| Stata | invnormal(0.975) |
| Wolfram Language (Mathematica) | InverseCDF[NormalDistribution[0, 1], 0.975][14][15] |
See also
Notes
- ↑ Rees, DG (1987), Foundations of Statistics, CRC Press, p. 246, ISBN 0-412-28560-6,
Why 95% confidence? Why not some other confidence level? The use of 95% is partly convention, but levels such as 90%, 98% and sometimes 99.9% are also used.
- ↑ "Engineering Statistics Handbook: Confidence Limits for the Mean". National Institute of Standards and Technology. Archived from the original on 5 February 2008. Retrieved 2008-02-04.
Although the choice of confidence coefficient is somewhat arbitrary, in practice 90%, 95%, and 99% intervals are often used, with 95% being the most commonly used.
- ↑ Olson, Eric T; Olson, Tammy Perry (2000), Real-Life Math: Statistics, Walch Publishing, p. 66, ISBN 0-8251-3863-9,
While other stricter, or looser, limits may be chosen, the 95 percent interval is very often preferred by statisticians.
- ↑ Swift, MB. "Comparison of Confidence Intervals for a Poisson Mean - Further Considerations". Communications in Statistics - Theory and Methods. 38 (5). pp. 748–759. doi:10.1080/03610920802255856.
In modern applied practice, almost all confidence intervals are stated at the 95% level.
- ↑ Simon, Steve (2002), Why 95% confidence limits?, archived from the original on 28 January 2008, retrieved 2008-02-01
- ↑ Moher, D; Schulz, KF; Altman, DG (2001), "The CONSORT statement: revised recommendations for improving the quality of reports of parallel-group randomised trials.", Lancet, 357 (9263): 1191–1194, doi:10.1016/S0140-6736(00)04337-3, PMID 11323066, retrieved 4 February 2008
- ↑ "Resources for Authors: Research". BMJ Publishing Group Ltd. Archived from the original on 12 February 2008. Retrieved 2008-02-04.
For standard original research articles please provide the following headings and information: [...] results - main results with (for quantitative studies) 95% confidence intervals and, where appropriate, the exact level of statistical significance and the number need to treat/harm
- ↑ Borradaile, Graham J. (2003), Statistics of Earth Science Data, Springer, p. 79, ISBN 3-540-43603-0,
For simplicity, we adopt the common earth sciences convention of a 95% confidence interval.
- ↑ Cook, Sarah (2004), Measuring Customer Service Effectiveness, Gower Publishing, p. 24, ISBN 0-566-08538-0,
Most researchers use a 95 per cent confidence interval
- ↑ Gosling, J. (1995), Introductory Statistics, Pascal Press, pp. 78–9, ISBN 1-86441-015-9
- ↑ Fisher, Ronald (1925), Statistical Methods for Research Workers, Edinburgh: Oliver and Boyd, p. 47, ISBN 0-05-002170-2
- ↑ Fisher, Ronald (1925), Statistical Methods for Research Workers, Edinburgh: Oliver and Boyd, ISBN 0-05-002170-2, Table 1
- ↑ White, John S. (June 1970), "Tables of Normal Percentile Points", Journal of the American Statistical Association, American Statistical Association, 65 (330): 635–638, doi:10.2307/2284575, JSTOR 2284575
- ↑ InverseCDF, Wolfram Language Documentation Center.
- ↑ NormalDistribution, Wolfram Language Documentation Center.
Further reading
- Gardner, Martin J; Altman, Douglas G, eds. (1989), Statistics with confidence, BMJ Books, ISBN 978-0-7279-0222-1