Margin of error
The margin of error is a statistic expressing the amount of random sampling error in a survey's results. It asserts a likelihood (not a certainty) that the result from a sample is close to the number one would get if the whole population had been queried. The likelihood of a result being "within the margin of error" is itself a probability, commonly 95%, though other values are sometimes used. The larger the margin of error, the less confidence one should have that the poll's reported results are close to the true figures; that is, the figures for the whole population. Margin of error applies whenever a population is incompletely sampled.
Margin of error is often used in non-survey contexts to indicate observational error in reporting measured quantities. In astronomy, for example, the convention is to report the margin of error as, for example, 4.2421(16) light-years (the distance to Proxima Centauri), with the number in parentheses indicating the expected range of values in the matching digits preceding; in this case, 4.2421(16) is equivalent to 4.2421 ± 0.0016.[1] The latter notation, with the "±", is more commonly seen in most other science and engineering fields.
Explanation
The margin of error is usually defined as the "radius" (or half the width) of a confidence interval for a particular statistic from a survey. One example is the percent of people who prefer product A versus product B. When a single, global margin of error is reported for a survey, it refers to the maximum margin of error for all reported percentages using the full sample from the survey. If the statistic is a percentage, this maximum margin of error can be calculated as the radius of the confidence interval for a reported percentage of 50%.
The margin of error has been described as an "absolute" quantity, equal to a confidence interval radius for the statistic. For example, if the true value is 50 percentage points, and the statistic has a confidence interval radius of 5 percentage points, then we say the margin of error is 5 percentage points. As another example, if the true value is 50 people, and the statistic has a confidence interval radius of 5 people, then we might say the margin of error is 5 people.
In some cases, the margin of error is not expressed as an "absolute" quantity; rather it is expressed as a "relative" quantity. For example, suppose the true value is 50 people, and the statistic has a confidence interval radius of 5 people. If we use the "absolute" definition, the margin of error would be 5 people. If we use the "relative" definition, then we express this absolute margin of error as a percent of the true value. So in this case, the absolute margin of error is 5 people, but the "percent relative" margin of error is 10% (because 5 people are ten percent of 50 people). Often, however, the distinction is not explicitly made, yet usually is apparent from context.
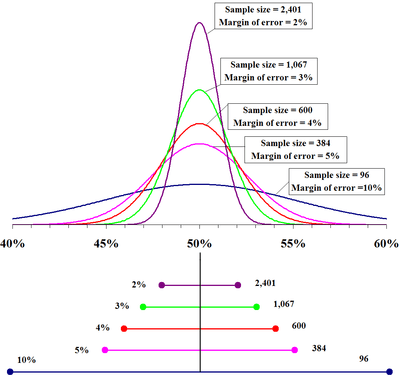
Like confidence intervals, the margin of error can be defined for any desired confidence level, but usually a level of 90%, 95% or 99% is chosen (typically 95%). This level is the percentage of polls, if repeated with the same design and procedure, whose margin of error around the reported percentage would include the "true" percentage. Along with the confidence level, the sample design for a survey, and in particular its sample size, determines the magnitude of the margin of error. A larger sample size produces a smaller margin of error, all else remaining equal.
If the exact confidence intervals are used, then the margin of error takes into account both sampling error and non-sampling error. If an approximate confidence interval is used (for example, by assuming the distribution is normal and then modeling the confidence interval accordingly), then the margin of error may only take random sampling error into account. It does not represent other potential sources of error or bias such as a non-representative sample-design, poorly phrased questions, people lying or refusing to respond, the exclusion of people who could not be contacted, or miscounts and miscalculations.
Concept
An example from the 2004 U.S. presidential campaign will be used to illustrate concepts throughout this article. According to an October 2, 2004 survey by Newsweek, 47% of registered voters would vote for John Kerry/John Edwards if the election were held on that day, 45% would vote for George W. Bush/Dick Cheney, and 2% would vote for Ralph Nader/Peter Camejo. The size of the sample was 1,013.[2] Unless otherwise stated, the remainder of this article uses a 95% level of confidence.
Basic concept
Polls basically involve taking a sample from a certain population. In the case of the Newsweek poll, the population of interest is the population of people who will vote. Because it is impractical to poll everyone who will vote, pollsters take smaller samples that are intended to be representative, that is, a random sample of the population.[3] It is possible that pollsters sample 1,013 voters who happen to vote for Bush when in fact the population is evenly split between Bush and Kerry, but this is extremely unlikely (p = 0.51013 ≈ 1.1 × 10−305) given that the sample is random.
Sampling theory provides methods for calculating the probability that the poll results differ from reality by more than a certain amount, simply due to chance; for instance, that the poll reports 47% for Kerry but his support is actually as high as 50%, or is really as low as 44%. This theory and some Bayesian assumptions suggest that the "true" percentage will probably be fairly close to 47%. The more people that are sampled, the more confident pollsters can be that the "true" percentage is close to the observed percentage. The margin of error is a measure of how close the results are likely to be.
However, the margin of error only accounts for random sampling error, so it is blind to systematic errors that may be introduced by non-response or by interactions between the survey and subjects' memory, motivation, communication and knowledge.[4]
Calculations assuming random sampling
This section will briefly discuss the standard error of a percentage, the corresponding confidence interval, and connect these two concepts to the margin of error. For simplicity, the calculations here assume the poll was based on a simple random sample from a large population.
The standard error of a reported proportion or percentage p measures its accuracy, and is the estimated standard deviation of that percentage. It can be estimated from just p and the sample size, n, if n is small relative to the population size, using the following formula:[5]

When the sample is not a simple random sample from a large population, the standard error and the confidence interval must be estimated through more advanced calculations. Linearization and resampling are widely used techniques for data from complex sample designs.
Note that there is not necessarily a strict connection between the true confidence interval, and the true standard error. The true p percent confidence interval is the interval [a, b] that contains p percent of the distribution, and where (100 − p)/2 percent of the distribution lies below a, and (100 − p)/2 percent of the distribution lies above b. The true standard error of the statistic is the square root of the true sampling variance of the statistic. These two may not be directly related, although in general, for large distributions that look like normal curves, there is a direct relationship.
In the Newsweek poll, Kerry's level of support p = 0.47 and n = 1,013. The standard error (0.016 or 1.6%) helps to give a sense of the accuracy of Kerry's estimated percentage (47%). A Bayesian interpretation of the standard error is that although we do not know the "true" percentage, it is highly likely to be located within two standard errors of the estimated percentage (47%). The standard error can be used to create a confidence interval within which the "true" percentage should be to a certain level of confidence.
The estimated percentage plus or minus its margin of error is a confidence interval for the percentage. In other words, the margin of error is half the width of the confidence interval. It can be calculated as a multiple of the standard error, with the factor depending of the level of confidence desired; a margin of one standard error gives a 68% confidence interval, while the estimate plus or minus 1.96 standard errors is a 95% confidence interval, and a 99% confidence interval runs 2.58 standard errors on either side of the estimate.
Definition
The margin of error for a particular statistic of interest is usually defined as the radius (or half the width) of the confidence interval for that statistic.[6][7] The term can also be used to mean sampling error in general. In media reports of poll results, the term usually refers to the maximum margin of error for any percentage from that poll.
Different confidence levels
For a simple random sample from a large population, the maximum margin of error, Em, is a simple re-expression of the sample size n. The numerators of these equations are rounded to two decimal places.
- At X confidence, (See Inverse error function)
- At 99% confidence,
- At 95% confidence,
- At 90% confidence,


If an article about a poll does not report the margin of error, but does state that a simple random sample of a certain size was used, the margin of error can be calculated for a desired degree of confidence using one of the above formulae. Also, if the 95% margin of error is given, one can find the 99% margin of error by increasing the reported margin of error by about 30%.
As an example of the above, a random sample of size 400 will give a margin of error, at a 95% confidence level, of 0.98/20 or 0.049—just under 5%. A random sample of size 1600 will give a margin of error of 0.98/40, or 0.0245—just under 2.5%. A random sample of size 10000 will give a margin of error at the 95% confidence level of 0.98/100, or 0.0098—just under 1%.
Maximum and specific margins of error
While the margin of error typically reported in the media is a poll-wide figure that reflects the maximum sampling variation of any percentage based on all respondents from that poll, the term margin of error also refers to the radius of the confidence interval for a particular statistic.
The margin of error for a particular individual percentage will usually be smaller than the maximum margin of error quoted for the survey. This maximum only applies when the observed percentage is 50%, and the margin of error shrinks as the percentage approaches the extremes of 0% or 100%.
In other words, the maximum margin of error is the radius of a 95% confidence interval for a reported percentage of 50%. If p moves away from 50%, the confidence interval for p will be shorter. Thus, the maximum margin of error represents an upper bound to the uncertainty; one is at least 95% certain that the "true" percentage is within the maximum margin of error of a reported percentage for any reported percentage.
Effect of population size
The formula above for the margin of error assume that there is an infinitely large population and thus do not depend on the size of the population of interest. According to sampling theory, this assumption is reasonable when the sampling fraction is small. The margin of error for a particular sampling method is essentially the same regardless of whether the population of interest is the size of a school, city, state, or country, as long as the sampling fraction is less than 5%.
In cases where the sampling fraction exceeds 5%, analysts can adjust the margin of error using a finite population correction (FPC) to account for the added precision gained by sampling close to a larger percentage of the population. FPC can be calculated using the formula:[8]

To adjust for a large sampling fraction, the fpc factored into the calculation of the margin of error, which has the effect of narrowing the margin of error. It holds that the FPC approaches zero as the sample size (n) approaches the population size (N), which has the effect of eliminating the margin of error entirely. This makes intuitive sense because when N = n, the sample becomes a census and sampling error becomes moot.
Analysts should be mindful that the samples remain truly random as the sampling fraction grows, lest sampling bias be introduced.
Other statistics
Confidence intervals can be calculated, and so can margins of error, for a range of statistics including individual percentages, differences between percentages, means, medians,[9] and totals.
The margin of error for the difference between two percentages is larger than the margins of error for each of these percentages, and may even be larger than the maximum margin of error for any individual percentage from the survey.
Comparing percentages
In a plurality voting system, where the winner is the candidate with the most votes, it is important to know who is ahead. The terms statistical tie and statistical dead heat are sometimes used to describe reported percentages that differ by less than a margin of error, but these terms can be misleading.[10][11] For one thing, the margin of error as generally calculated is applicable to an individual percentage and not the difference between percentages, so the difference between two percentage estimates may not be statistically significant even when they differ by more than the reported margin of error. The survey results also often provide strong information even when there is not a statistically significant difference.
When comparing percentages, it can accordingly be useful to consider the probability that one percentage is higher than another.[12] In simple situations, this probability can be derived with: 1) the standard error calculation introduced earlier; 2) the formula for the variance of the difference of two random variables; and 3) an assumption that if anyone does not choose Candidate A they will choose Candidate B, and vice versa; they are perfectly negatively correlated. This may not be a tenable assumption when there are more than two possible poll responses. For more complex survey designs, different formulas for calculating the standard error of difference must be used.
The standard error of the difference of percentages p for Candidate A and q for Candidate B, assuming that they are perfectly negatively correlated, follows:

Given the observed percentage difference p − q (2% or 0.02) and the standard error of the difference calculated above (0.03), any statistical calculator may be used to calculate the probability that a sample from a normal distribution with mean 0.02 and standard deviation 0.03 is greater than 0.
See also
Notes
- ↑ "Errors". COSMOS - The SAO Encyclopedia of Astronomy. Swinburne University of Technology. Retrieved 30 December 2013.
- ↑ "NEWSWEEK POLL: First Presidential Debate" (Press release). Newsweek. 2 October 2004. Retrieved 2006-05-31.
- ↑ Wonnacott and Wonnacott (1990), pp. 4–8.
- ↑ Sudman, S.L. and Bradburn N.M. (1982) Asking Questions. Jossey-Bass: pp. 17-19
- ↑ Sample Sizes, Margin of Error, Quantitative AnalysisArchived January 21, 2012, at the Wayback Machine.
- ↑ Lohr, Sharon L. (1999). Sampling: Design and Analysis. Pacific Grove, California: Duxbury Press. p. 49. ISBN 0-534-35361-4.
The margin of error of an estimate is the half-width of the confidence interval ...
- ↑ Stokes, Lynne; Tom Belin (2004). "What is a Margin of Error?" (PDF). What is a Survey?. Survey Research Methods Section, American Statistical Association. p. 64. Retrieved 2006-05-31.
- ↑ Isserlis, L. (1918). "On the value of a mean as calculated from a sample". Journal of the Royal Statistical Society. Blackwell Publishing. 81 (1): 75–81. doi:10.2307/2340569. JSTOR 2340569. (Equation 1)
- ↑ Income - Median Family Income in the Past 12 Months by Family Size, U.S. Census Bureau. Retrieved February 15, 2007.
- ↑ Braiker, Brian. "The Race is On: With voters widely viewing Kerry as the debate’s winner, Bush’s lead in the NEWSWEEK poll has evaporated". MSNBC, October 2, 2004. Retrieved on 2 February 2007.
- ↑ Rogosa, D.R. (2005). A school accountability case study: California API awards and the Orange County Register margin of error folly. In R.P. Phelps (Ed.), Defending standardized testing (pp. 205–226). Mahwah, NJ: Lawrence Erlbaum Associates.
- ↑ Drum, Kevin. Political Animal, Washington Monthly, August 19, 2004. Retrieved on 15 February 2007.
References
- Sudman, Seymour and Bradburn, Norman (1982). Asking Questions: A Practical Guide to Questionnaire Design. San Francisco: Jossey Bass. ISBN 0-87589-546-8
- Wonnacott, T.H. and R.J. Wonnacott (1990). Introductory Statistics (5th ed.). Wiley. ISBN 0-471-61518-8.
External links
| Wikibooks has more on the topic of: Margin of error |
- Hazewinkel, Michiel, ed. (2001), "Errors, theory of", Encyclopedia of Mathematics, Springer, ISBN 978-1-55608-010-4
- Weisstein, Eric W. "Margin of Error". MathWorld.
- Stokes, Lynne; Tom Belin (2004). "What is a Margin of Error?" (PDF). What is a Survey?. Survey Research Methods Section, American Statistical Association. pp. 63–67. Retrieved 2006-05-31.