1954 Pacific hurricane season
| |
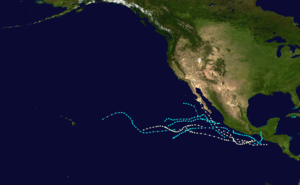
| Season summary map |
| First system formed |
June 18, 1954 |
| Last system dissipated |
November 1, 1954 |
| Strongest storm1 |
Seven – 981 mbar (hPa) (28.97 inHg), 50 mph (85 km/h) |
| Total depressions |
11 |
| Total storms |
11 |
| Hurricanes |
3 |
| Major hurricanes (Cat. 3+) |
0 |
| Total fatalities |
5 direct, 35 indirect |
| Total damage |
Unknown |
| 1Strongest storm is determined by lowest pressure |
Pacific hurricane seasons
1952, 1953, 1954, 1955, 1956 |
The 1954 Pacific hurricane season featured below-average activity, with eleven tropical storms identified.[note 1] The season officially started on May 15 and lasted until November 30. These dates conventionally delimit the period of each year when most tropical cyclones form in the Pacific basin.[2] The majority of the year's storm remained offshore and caused little to no adverse impact on land. However, a tropical storm in October brought flooding rain to Mexico and Guatemala that left five people dead and thousands homeless. An unknown disease in the storm's wake killed a further 35 people.
The relative lack of activity is a byproduct of limited monitoring tools at the time. In 1954, Pacific hurricanes were only able to be identified by ship reports (either post-trip logs or in situ transmissions) and coastal observations.[3] No more than eight coastal cities reported regular observations. Additionally, only two cities, Empalme, Sonora, and Mazatlán, Sinaloa, launched radiosondes—a key factor in detecting tropical cyclones at the time—further limiting detection capabilities.[4]
Storms
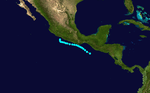
Tropical Storm One
| Tropical storm (SSHWS) |
|
|
| Duration |
June 18 – June 22 |
| Peak intensity |
50 mph (85 km/h) (1-min) ≤1005 mbar (hPa) |
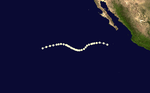
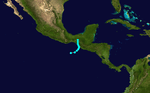
On June 17, an area of low pressure was identified on surface weather maps just off the coast of Guatemala.[5] The following day, the system was classified as a tropical storm approximately 210 mi (340 km) southwest of Guatemala City. Tracking generally northwest, the system acquired maximum sustained winds of 50 mph (85 km/h). On June 20–21, the storm moved parallel to the Mexican coastline before turning north on June 22. It was last noted offshore on this day, approximately 50 mi (85 km) south of Lázaro Cárdenas, Michoacán.[6]
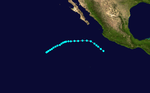
Tropical Storm Two
| Tropical storm (SSHWS) |
|
|
| Duration |
July 10 – July 17 |
| Peak intensity |
50 mph (85 km/h) (1-min) ≤1000 mbar (hPa) |
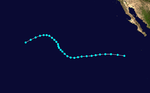
Tropical Storm Two existed from July 10 to July 16.
Hurricane Three
| Category 1 hurricane (SSHWS) |
|
|
| Duration |
July 12 – July 17 |
| Peak intensity |
85 mph (140 km/h) (1-min) |
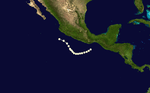
This hurricane made landfall in the Baja California Peninsula.
Remnant moisture from this system led to rainfall over Arizona and California, with accumulations reaching 2 in (51 mm) in the latter.[7]
Hurricane Four
| Category 1 hurricane (SSHWS) |
|
|
| Duration |
July 25 – August 1 |
| Peak intensity |
85 mph (140 km/h) (1-min) |
Hurricane Four existed from July 25 to August 1.
Tropical Storm Five
| Tropical storm (SSHWS) |
|
|
| Duration |
September 2 – September 9 |
| Peak intensity |
50 mph (85 km/h) (1-min) |
Tropical Storm Five existed from September 2 to September 9.
Tropical Storm Six
| Tropical storm (SSHWS) |
|
|
| Duration |
September 5 – September 8 |
| Peak intensity |
50 mph (85 km/h) (1-min) |
Tropical Storm Six existed from September 5 to September 9.
Tropical Storm Seven
| Tropical storm (SSHWS) |
|
|
| Duration |
September 15 – September 21 |
| Peak intensity |
50 mph (85 km/h) (1-min) 981 mbar (hPa) |
Tropical Storm Seven existed from September 15 to September 21.
Tropical Storm Eight
| Tropical storm (SSHWS) |
|
|
| Duration |
September 21 – September 27 |
| Peak intensity |
50 mph (85 km/h) (1-min) |
Tropical Storm Eight existed from September 21 to September 27.
Hurricane Nine
| Category 1 hurricane (SSHWS) |
|
|
| Duration |
September 27 – October 1 |
| Peak intensity |
85 mph (140 km/h) (1-min) |
Hurricane Nine existed from September 27 to October 1.
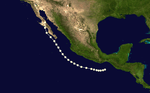
Tropical Storm Ten
| Tropical storm (SSHWS) |
|
|
| Duration |
October 12 – October 14 |
| Peak intensity |
50 mph (85 km/h) (1-min) ≤1000 mbar (hPa) |
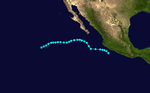
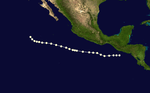
Tropical Storm Ten existed from October 12 to October 14. Surface weather maps indicate the system had a central pressure of at most 1000 mbar (hPa; 29.53 inHg) on October 13.[8]
Heavy rains from the storm affected much of Mexico, impacting areas as far north as Tampico. Flooding along the Pánuco River rendered 160 people homeless; electrical service and water supplies were disrupted.[9] The towns of Panuco and Revenadero were largely destroyed; thousands of acres of crops were submerged and livestock loss was severe.[10] Five people died due to flooding in coastal towns near Tampico. An unidentified diseased in the storm's wake claimed 35 lives.[11] Aid workers traveled along the swollen Pánuco River to distribute supplies, including food and snake bite serum.[9] Severe flooding also plagued Guatemala, with thousands rendered homeless.[12]
Hurricane Eleven
| Category 1 hurricane (SSHWS) |
|
|
| Duration |
October 26 – November 1 |
| Peak intensity |
85 mph (140 km/h) (1-min) |
Hurricane Eleven existed from October 26 to November 1.
See also
Notes
- ↑ An average season, based on 1981–2010 averages, is defined as 15.4 tropical storms, 7.6 hurricanes, and 3.2 major hurricanes.[1]
References
- ↑ "Background Information: East Pacific Hurricane Season". Climate Prediction Center. College Park, Maryland: National Oceanic and Atmospheric Administration. May 22, 2014. Retrieved May 29, 2014.
- ↑ Christopher W. Landsea; Neal Dorst; Erica Rule (June 2, 2011). "G: Tropical Cyclone Climatology". Hurricane Research Division: Frequently Asked Questions. Atlantic Oceanographic and Meteorological Laboratory. National Oceanic and Atmospheric Administration. G1) When is hurricane season ?. Retrieved January 17, 2016.
- ↑ Sandy Delgado; et al. (2014). Reanalysis of the 1954–1963 Atlantic hurricane season (PDF) (Report). National Hurricane Center. p. 9. Archived from the original (PDF) on March 13, 2016. Retrieved January 17, 2016.
- ↑ Sergio Serra C. (April 1971). "Hurricanes and Tropical Storms of the West Coast of Mexico" (PDF). Monthly Weather Review. American Meteorological Society. 99 (4): 302–308. Bibcode:1971MWRv...99..302S. doi:10.1175/1520-0493(1971)099<0302:HATSOT>2.3.CO;2. Retrieved January 17, 2016.
- ↑ "June 17, 1954, Surface Weather Analysis" (PDF). United States Weather Bureau. National Oceanic and Atmospheric Administration. 1954. Retrieved January 18, 2016.
- ↑ National Hurricane Center; Hurricane Research Division; Central Pacific Hurricane Center. "The Northeast and North Central Pacific hurricane database 1949–2015". United States National Oceanic and Atmospheric Administration's National Weather Service. A guide on how to read the database is available here.
- ↑ Jack Williams (May 17, 2005). "Background: California's tropical storms". USAToday. Retrieved January 17, 2016.
- ↑ "October 13, 1954, Surface Weather Analysis" (PDF). United States Weather Bureau. National Oceanic and Atmospheric Administration. 1954. Retrieved January 17, 2016.
- 1 2 "Many Homeless as Result of Floods In Tampico Area". Brownwood Bulletin. Tampico, Mexico. United Press. October 15, 1954. p. 29. Retrieved January 17, 2016 – via Newspapers.com.

- ↑ "Disease Rages in Wake of Floods". The Terre Haute Tribune. Tampico, Mexico. Associated Press. October 16, 1954. p. 2. Retrieved January 17, 2016 – via Newspapers.com.
- ↑ "Disease Follows Flood". Greeley Daily Tribune. Tampico, Mexico. Associated Press. October 16, 1954. p. 1. Retrieved January 17, 2016 – via Newspapers.com.
- ↑ "Floods Hit Guatemala". The Eugene Guard. Guatemala. October 15, 1954. p. 2. Retrieved January 17, 2016 – via Newspapers.com.