1973 Pacific hurricane season
 | |
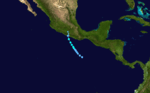
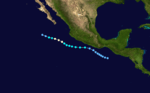
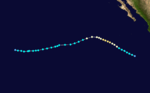
| Season summary map | |
| First system formed | June 2, 1973 |
|---|---|
| Last system dissipated | October 9, 1973 |
| Strongest storm1 | Ava – 915 mbar (hPa) (27.02 inHg), 160 mph (260 km/h) (1-minute sustained) |
| Total depressions | 18 |
| Total storms | 12 |
| Hurricanes | 7 |
| Major hurricanes (Cat. 3+) | 3 |
| Total fatalities | 0 |
| Total damage | Unknown |
| 1Strongest storm is determined by lowest pressure | |
1971, 1972, 1973, 1974, 1975 | |
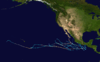
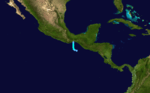
The 1973 Pacific hurricane season was an event in tropical cyclone meteorology. The most important system this year was Hurricane Ava, which was the most intense Pacific hurricane known at the time.[1] Several other much weaker tropical cyclones came close to, or made landfall on, the Pacific coast of Mexico. The most serious of these was Hurricane Irah, which downed power and communication lines in parts of the Baja California Peninsula; the other landfalling storms caused rain and some flooding. No tropical cyclone this season caused any deaths.[2]
This season had a quick start but a slow end. Overall activity was below average, with twelve named systems in total. Of these, five were tropical storms, seven were hurricanes, of which three were major (Category 3 or higher on the Saffir-Simpson hurricane scale).[1] Just one storm formed in August, one of the least active Augusts ever in the east Pacific.[1] The season officially started May 15, 1973, in the eastern Pacific, and June 1, 1973, in the central Pacific, and lasted until November 30, 1973. These dates conventionally delimit the period of each year when most tropical cyclones form in the northeastern Pacific Ocean.[3] All tropical cyclones this season formed in the eastern north Pacific Ocean, often off the coast of Mexico. As is usual in the northern hemisphere, most traveled generally westward or northwestward, and two reached as far as the waters south of the Hawaiian Islands.[1]
Season summary

The season began with the formation of the pre-Ava tropical depression on June 2 and ended with the dissipation of Tropical Lillian on October 9. The season lasted a total of 129 days. No named storms formed in May, three in June, four in July, one in August, three in September, one in October, and none in November.[1] Another six tropical depressions formed during the year, but data on them is unavailable.[2] All of these tropical cyclones formed in the eastern north Pacific tropical cyclone basin,[1] which encompasses the Pacific Ocean north of the equator east of 140°W. None formed in the central north Pacific,[1] which is the remainder of the Pacific Ocean east of the international dateline.
Of the tropical cyclones that formed this year, were twelve tropical storms and seven were hurricanes. Of those hurricanes, three of them were major hurricanes because they reached Category 3 or higher on the Saffir-Simpson Scale.[1] These totals are all below the long-term averages of thirteen tropical storms, nine hurricanes, and four major hurricanes.[4] At the time, this season's total of twelve named tropical cyclones was exactly average, although at the time the climatology in this basin was weak because satellite coverage was spotty before 1966.[5]
This season, all advisories and tropical cyclone data were released and collected by two agencies, the Eastern Pacific Hurricane Center in Redwood City, California,[6] and the Central Pacific Hurricane Center in Honolulu, Hawaii,[7] both of which were coextensive with the National Weather Service Forecast Offices in their respective cities.[8][9] The EPHC covered the area between the coast of North America and 140°W,[6] and the CPHC the remainder of the area.[7]
Hurricane Ava
| Category 5 hurricane (SSHWS) | |||
|---|---|---|---|
| |||
| Duration | June 2 – June 12 | ||
| Peak intensity | 165 mph (270 km/h) (1-min) 915 mbar (hPa) | ||
.PNG)
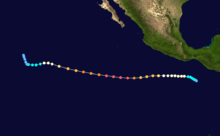
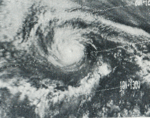
A tropical depression formed on June 2. It steadily strengthened and headed in a generally westerly direction. It moved slowly and became Hurricane Ava on June 4. Two days later, it became a major hurricane and it sped up. On June 7, it became a Category 5 hurricane. It then started weakening and slowed down until it dissipated on June 12.[1] No deaths or damages were attributed to Hurricane Ava.[2]
Ava's minimum central pressure was 915 millibars, and its maximum sustained winds reached 140 knots (260 km/h). This made Ava the most intense recorded east Pacific hurricane at the time. Ava reached Category 5 intensity on June 7, the earliest date in an east Pacific season that a hurricane has done so. It was also the second known Category 5 storm in the east Pacific; (behind Patsy in 1959). Ava is the strongest June storm, the fifth most intense east Pacific hurricane, and was the only June Category 5 on record until 2010.[1]
Ava was also flown into by hurricane hunter aircraft in what was the first penetration of a Pacific hurricane by NOAA aircraft.[10] During these flights, radars and other devices were tested, and wind speed, pressure, and wave heights were measured. This is the reason why Hurricane Ava's pressure is measured instead of estimated.[10] Ava was also photographed from Skylab because it was visible during one of the missions. At that time, it was coincidentally on the surface of the Earth directly underneath the space station.[11] All in all, these made Hurricane Ava one of the best-observed Pacific hurricanes at the time.
Tropical Storm Bernice
| Tropical storm (SSHWS) | |||
|---|---|---|---|
| |||
| Duration | June 22 – June 23 | ||
| Peak intensity | 70 mph (110 km/h) (1-min) 990 mbar (hPa) | ||
A nearly stationary disturbance in the Intertropical Convergence Zone spent three days organizing and finally developed into a tropical depression on June 22. The cyclone started heading northwest.[2] After intensifying into a tropical storm, Bernice made landfall on June 23 at a location roughly 50 mi (80 km) southwest of Zihuatanejo. It dissipated later that day.[2] Bernice exposed two ships to gales, but otherwise neither deaths nor significant impact was reported.[2] At its peak, Tropical Storm Bernice had winds of 70 miles per hour (110 km/h).[1]
Tropical Storm Claudia
| Tropical storm (SSHWS) | |||
|---|---|---|---|
| |||
| Duration | June 26 – June 29 | ||
| Peak intensity | 65 mph (100 km/h) (1-min) 999 mbar (hPa) | ||
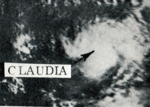
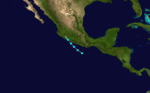
A tropical depression formed June 26 from a westward-moving area of disturbed weather. The next day, it developed gale-force winds and was named Claudia. Claudia headed northwesterly and then northwards and made landfall on June 28 approximately 30 mi (50 km) east of Acapulco. It dissipated inland the next day.[2] No deaths or casualties were reported due to this tropical cyclone.[2]
Hurricane Doreen
| Category 4 hurricane (SSHWS) | |||
|---|---|---|---|
| |||
| Duration | July 18 – August 3 | ||
| Peak intensity | 140 mph (220 km/h) (1-min) 968 mbar (hPa) | ||
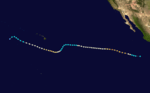
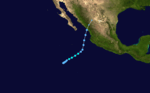
On July 18, a tropical storm formed from a disturbance in the Intertropical Convergence Zone and was named Doreen. It steadily intensified, and became a hurricane on July 19.[2] Doreen briefly reached Category 4 strength on July 21 with a relatively high central pressure of 972 mb (28.7 inHg). It then weakened steadily as its path carried it on a direct path to the Big Island of Hawaii. Doreen weakened to a tropical storm as it entered the Central Pacific Hurricane Center's area of responsibility on July 25.[1] A frontal system stuck between two high-pressure areas weakened as the two areas merged, creating a larger high pressure area that turned Doreen to the southwest on July 27. The hurricane then turned back to the northwest and strengthened back into a hurricane. It became a major hurricane again before weakening. Doreen dissipated August 3. Its remnant vortex continued westward until it dissipated under a trough near the dateline.[7] Doreen's sudden change of track and restrengthening was unusual.[2]
From formation to dissipation, Doreen lasted 16.25 days and traveled a distance of 4,200 mi (6,760 km).[1][2] This tied Hurricane Celeste's record for longest-lasting Pacific hurricane. Doreen was also the longest-lasting July tropical cyclone.[1] Hurricane Fico broke both of these records in the 1978 season.[1][12] Doreen remains the eighth-longest lasting Pacific tropical cyclone, tied with two other storms.[1] Several ships encountered Doreen. The most serious incident involved a Greek ship called Cornelia which lost its rudder in 35 ft (10 m) waves, but managed to escape and continue on its way to Panama. On the afternoon of July 29, 9 ft (2.7 m) swells and 3.5 ft (1.1 m) waves were seen from Kapoho.[7] Otherwise, no damages or deaths were blamed on this tropical cyclone.[2][7]
Hurricane Emily
| Category 4 hurricane (SSHWS) | |||
|---|---|---|---|
| |||
| Duration | July 21 – July 28 | ||
| Peak intensity | 140 mph (220 km/h) (1-min) ≤ 972 mbar (hPa) | ||

A depression formed July 21 from squalls in the Gulf of Tehuantepec and headed west-northwest and strengthened into a tropical storm. Emily continued moving nearly parallel to the coast before turning to the west while steadily intensifying. Emily eventually reached Category 4 intensity on July 22. Emily then weakened as it turned to the northwest. It dissipated on July 28. Emily's wind field was large enough to bring gales areas 300 mi (480 km) east of the hurricane from July 22 to 24.[2] This tropical cyclone caused no deaths or damage.[2] Emily had an pressure of 972 mbar, which is unusually high for a hurricane of Category 4 strength.
Hurricane Florence
| Category 1 hurricane (SSHWS) | |||
|---|---|---|---|
| |||
| Duration | July 25 – July 30 | ||
| Peak intensity | 90 mph (150 km/h) (1-min) ≤ 990 mbar (hPa) | ||
On July 25, a depression formed off the coast of Guatemala. The storm made a close approach to the Mexican coast as a depression, but did not make landfall. Just after that, it strengthened into a tropical storm. Florence headed west and then west-northwest. It became a hurricane on July 29. It began weakening thereafter. Florence dissipated on July 30.[2] No damages or deaths were reported.[2]
Tropical Storm Glenda
| Tropical storm (SSHWS) | |||
|---|---|---|---|
| |||
| Duration | July 30 – August 5 | ||
| Peak intensity | 60 mph (95 km/h) (1-min) 989 mbar (hPa) | ||

A depression that had formed on July 30 from a tropical disturbance quickly strengthened into a tropical storm and was named Glenda. It took a path similar to both Florence and Emily, but further from the shore. Glenda dissipated August 5. At the time it still had winds of 40 knots (70 km/h),[2] down from its peak of 60 miles per hour (97 km/h). No deaths, damage, or other impact was reported.[2]
Tropical Storm Heather
| Tropical storm (SSHWS) | |||
|---|---|---|---|
| |||
| Duration | August 31 – September 1 | ||
| Peak intensity | 50 mph (85 km/h) (1-min) ≤ 1004 mbar (hPa) | ||
The only storm to form in August this year formed on August 31 from an area of circulation in the ITCZ over the Gulf of Tehuantepec.[1][2] It became a tropical depression on August 30. After moving northwest for a bit, it became a tropical storm and headed almost due north towards Mexico. Heather dissipated September 1, just before making landfall.[2] Tropical Storm Heather caused no deaths or damage to any location in the coastal area of the Gulf of Tehuantepec.[2]
Hurricane Irah
| Category 2 hurricane (SSHWS) | |||
|---|---|---|---|
| |||
| Duration | September 22 – September 26 | ||
| Peak intensity | 110 mph (175 km/h) (1-min) ≤ 955 mbar (hPa) | ||
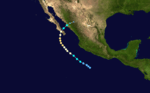
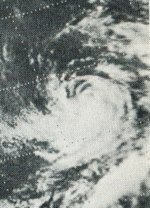
A depression formed September 22. It became a tropical storm on September 23 and a hurricane on September 24. Irah took a northwesterly path and reached Category 2 strength on the Saffir-Simpson Hurricane Scale, and then dropped back down to a 1 as it recurved. It made landfall on Baja California and entered the Gulf of California as a tropical storm, making landfall again in northwestern Mexico approximately 30 mi (50 km) northwest of Los Mochis.[2] Irah's first landfall was the strongest of the season.[1] The hurricane dissipated on September 27 while heading east-northeast over mainland Mexico.[2]
Irah blew over some power and communication lines during its passage over the southern tip of the Baja California Peninsula.[2] Heavy rain fell over parts of Mexico, with the highest total being 10.24 in (260 mm) at Sierra de la Laguna.[13] One person was injured and at least ten houses were destroyed in Cabo San Lucas.[14] No one was killed.[2] There was some concern that the hurricane could disrupt splashdown procedures for astronauts at the end of Skylab 3;[15] however, the return to Earth was not seriously affected.[16]
Tropical Storm Jennifer
| Tropical storm (SSHWS) | |||
|---|---|---|---|
| |||
| Duration | September 23 – September 27 | ||
| Peak intensity | 40 mph (65 km/h) (1-min) 1007 mbar (hPa) | ||

On September 23, another depression formed. It took a northeasterly path, rotating around the southern periphery of Hurricane Irah as part of a Fujiwara interaction. It strengthened into a tropical storm late on September 24.[2] The peak windspeed of this tropical cyclone was 40 miles per hour (60 km/h).[1] Jennifer then weakened to a depression and turned to the north-northeast. Jennifer brushed the Islas Marías. The cyclone made landfall near just southeast of Mazatlán and dissipated September 27.[2] Tropical Depression Jennifer caused rain over several parts of Mexico. The highest total was 7.48 in (190 mm) at Navarette/San Blas.[17] No one was killed and no damage was reported.[2]
Hurricane Katherine
| Category 2 hurricane (SSHWS) | |||
|---|---|---|---|
| |||
| Duration | September 29 – October 9 | ||
| Peak intensity | 100 mph (155 km/h) (1-min) ≤ 978 mbar (hPa) | ||
Katherine became a tropical storm on September 29, just six hours after forming. It headed out to sea. On October 1, it became a hurricane category 5 . It peaked in windspeed the next day. After weakening to storm strength, it crossed 140°W and entered the central Pacific.[2] Katherine continued its slightly south of westward track. It dropped to a depression on October 9, and dissipated shortly after that due to the influence of a cold trough.[7] The storm threatened land, causing casualties and damage.The hurricane had wind miles of 200 miles per hour.The damage cost $100 billion. 0 people died of the hurricane.[2][7]
Hurricane Lillian
| Category 1 hurricane (SSHWS) | |||
|---|---|---|---|
| |||
| Duration | October 5 – October 9 | ||
| Peak intensity | 85 mph (140 km/h) (1-min) 990 mbar (hPa) | ||

A depression that formed October 5 reached storm strength the same day. It generally paralleled the coast of Mexico far offshore. Lillian reached minimal hurricane strength on October 7 and peaked the next day. The hurricane began to weaken immediately thereafter and dissipated on October 9. Through its life, Lillian at first traveled generally west-northwestward, and then westward.[2] Lillian never threatened land, causing no known impact.[2]
Storm names
These names were used for storms that formed in the eastern Pacific during this season. It is the same list used in the 1969 season. Storms were named Katherine and Lillian for the first time this year. No names were retired, so this list was used again in the 1977 season.[1] Names that weren't assigned are colored gray.
|
|
|
The Central Pacific used names and numbers from the Western Pacific's typhoon list. No systems formed in the area, and thus no names were required.
Season effects
This is a table of all of the storms in the 1973 Pacific hurricane season. It includes their durations, peak intensities, names, landfall(s), damages, and death totals. Deaths in parentheses are additional and indirect (an example of an indirect death would be a traffic accident), but are still storm-related. Damage and deaths include totals while the storm was extratropical or a wave or a low.
| Saffir–Simpson hurricane wind scale | ||||||
| TD | TS | C1 | C2 | C3 | C4 | C5 |
| Storm name |
Dates active | Storm category
at peak intensity |
Max 1-min wind mph (km/h) |
Min. press. (mbar) |
Areas affected | Damage (millions USD) |
Deaths | |||
|---|---|---|---|---|---|---|---|---|---|---|
| Ava | June 2 – 12 | Category 5 hurricane | 165 (270) | 915 | None | None | 0 | |||
| Bernice | June 22 – 23 | Tropical storm | 70 (110) | 990 | Mexico | None | 0 | |||
| Claudia | June 26 – 29 | Tropical storm | 65 (100) | 999 | Mexico | None | 0 | |||
| Doreen | July 18 – August 3 | Category 4 hurricane | 140 (220) | 968 | None | None | 0 | |||
| Emily | July 21 – 28 | Category 4 hurricane | 140 (220) | 972 | None | None | 0 | |||
| Florence | July 25 – 30 | Category 1 hurricane | 90 (150) | 990 | None | None | 0 | |||
| Glenda | July 30 – August 5 | Tropical storm | 60 (95) | 989 | None | None | 0 | |||
| Heather | August 31 – September 1 | Tropical storm | 50 (85) | 1004 | Mexico | None | 0 | |||
| Irah | September 22 – 26 | Category 2 hurricane | 110 (175) | 955 | Mexico | Unknown | 0 | |||
| Jennifer | September 23 – 27 | Tropical storm | 40 (65) | 1007 | Mexico | 0 | ||||
| Katherine | September 29 – October 9 | Category 2 hurricane | 100 (155) | 978 | None | None | 0 | |||
| Lillian | October 5 – 9 | Category 1 hurricane | 85 (140) | 990 | None | None | 0 | |||
| Season Aggregates | ||||||||||
| 18[nb 1] cyclones | June 2 – October 9 | 165 (270) | 915 | Mexico | Unknown | 0 | ||||
See also
- List of Pacific hurricanes
- List of Pacific hurricane seasons
- 1973 Atlantic hurricane season
- 1973 Pacific typhoon season
- 1973 North Indian Ocean cyclone season
- Southern Hemisphere tropical cyclone seasons: 1972–73, 1973–74
Notes
- ↑ There were six other tropical cyclones which never reached tropical storm strength, but due to the unavailability of their data they are not added onto this table.
References
- 1 2 3 4 5 6 7 8 9 10 11 12 13 14 15 16 17 18 19 20 National Hurricane Center; Hurricane Research Division; Central Pacific Hurricane Center. "The Northeast and North Central Pacific hurricane database 1949–2015". United States National Oceanic and Atmospheric Administration's National Weather Service. A guide on how to read the database is available here.
- 1 2 3 4 5 6 7 8 9 10 11 12 13 14 15 16 17 18 19 20 21 22 23 24 25 26 27 28 29 30 31 32 Robert A. Baum (April 1974). "Eastern North Pacific Hurricane Season of 1973" (PDF). Monthly Weather Review. 102 (4): 296–306. Bibcode:1974MWRv..102..296B. doi:10.1175/1520-0493(1974)102<0296:ENPHSO>2.0.CO;2. Archived (PDF) from the original on 2009-05-05. Retrieved 2009-03-09.
- ↑ Neal Dorst. "Subject: G1) When is hurricane season ?". FAQ: Hurricanes, Typhoons, and Tropical Cyclones. Atlantic Oceanographic and Meteorological Laboratory. Archived from the original on 2009-05-05. Retrieved 2009-03-12.
- ↑ Climate Prediction Center, NOAA (2006-05-22). "Background Information: East Pacific Hurricane Season". National Oceanic and Atmospheric Administration. Archived from the original on 2009-05-18. Retrieved 2009-05-15.
- ↑ "Previous Tropical Systems in the Central Pacific". Central Pacific Hurricane Center. Archived from the original on 2009-05-27. Retrieved 2009-05-19.
- 1 2 Robert Sheets (June 1990). "The National Hurricane Center —Past, Present, and Future" (PDF). Weather and Forecasting. 5 (2): 197. Bibcode:1990WtFor...5..185S. doi:10.1175/1520-0434(1990)005<0185:tnhcpa>2.0.co;2. Archived (PDF) from the original on 2009-05-28. Retrieved 2009-05-25.
- 1 2 3 4 5 6 7 "The 1973 Central Pacific Tropical Cyclone Season". Central Pacific Hurricane Center. Archived from the original on 2009-05-05. Retrieved 2009-03-10.. Retrieved 2009-05-20.
- ↑ Charles J. Neumann (November 1985). "The Role in Statistical Models in the Prediction of Tropical Cyclone Motion". American Statistician. 39 (4): 347–57. doi:10.2307/2683013. JSTOR 2683013.
- ↑ "About CPHC". Central Pacific Hurricane Center. Archived from the original on 2009-05-28. Retrieved 2009-05-25.
- 1 2 F. J. Hoelzl (1973-06-06). "wea01151". National Weather Service Photo Library. National Oceanographic and Atmospheric Administration. Archived from the original on 2009-05-05. Retrieved 2009-03-09.
- ↑ "Introduction". SP-399 Skylab EREP Investigations Summary. National Aeronautics and Space Administration. Archived from the original on 4 April 2009. Retrieved 2009-05-15.
- ↑ Neal Dorst (2004-08-13). "Subject: E7) What is the farthest a tropical cyclone has traveled ?". FAQ: Hurricanes, Typhoons and Tropical Cyclones. Hurricane Research Division. Archived from the original on 2009-05-19. Retrieved 2009-05-15.
- ↑ David M. Roth. "Hurricane Irah —September 23–27, 1973" (GIF). Hydrometeorological Prediction Center. Retrieved 2008-08-11.
- ↑ "Homes Reported Destroyed by Irah". Newark Advocate. Associated Press. 1973-09-26. p. 1. Archived from the original on 2009-05-05. Retrieved 2009-03-11.
- ↑ UPI (1973-09-26). "Hurricane Irah Zeroes on Baja". El Paso Herald-Post. Retrieved 2009-03-11.
- ↑ "Skylab". Danville Register. 1973-09-26. p. 2. Retrieved 2009-03-11.
- ↑ David M. Roth. "Hurricane Jennifer — September 24–28, 1973". Hydrometeorological Prediction Center. Retrieved 2008-08-11.
External links
- Eastern North Pacific Hurricane Season of 1973
- CPHC season summary
- ATCR Eastern Pacific summary
- Unisys Archive
Tropical cyclones of the 1973 Pacific hurricane season | ||
|---|---|---|
| ||
| ||