The 1975–80 Southern Hemisphere tropical cyclone seasons ran year-round from July 1 to June 30 during each year between 1975 and 1980. Tropical cyclone activity in the Southern Hemisphere reaches its peak from mid-February to early March.
1975–1976 Southern Hemisphere tropical cyclone season
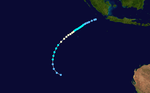
Tropical Storm 01P
| Tropical storm (SSHWS) |
|
|
| Duration |
July 31 – August 4 |
| Peak intensity |
85 km/h (50 mph) (1-min) |
Tropical Cyclone Ray
| Category 2 tropical cyclone (Australian scale) |
| Category 1 tropical cyclone (SSHWS) |
|
|
| Duration |
November 17 – November 25 |
| Peak intensity |
100 km/h (65 mph) (10-min) 973 hPa (mbar) |
Moderate Tropical Storm Audrey
| Moderate tropical storm (MFR) |
| Tropical storm (SSHWS) |
|
|
| Duration |
November 17 – November 29 |
| Peak intensity |
65 km/h (40 mph) (10-min) |
Tropical Depression Charlotte
| Tropical depression (SSHWS) |
|
|
| Duration |
November 18 – November 19 |
| Peak intensity |
30 km/h (15 mph) (1-min) 1007 hPa (mbar) |
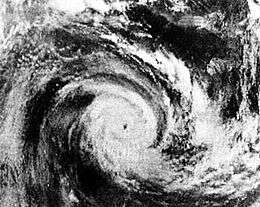
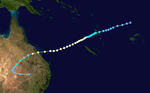
Severe Tropical Cyclone Joan
| Category 5 severe tropical cyclone (Australian scale) |
| Category 4 tropical cyclone (SSHWS) |
|
|
| Duration |
November 30 – December 10 |
| Peak intensity |
230 km/h (145 mph) (10-min) 915 hPa (mbar) |
On the morning of November 30, 1975, satellite imagery showed a large cloud mass in the Timor Sea. The satellite photograph received on the morning of December 1 showed that significant organization had occurred in the cloud mass during the previous 24 hours. It was deemed at 0115 UTC that the system be named the developing cyclone Joan, located about 310 km west-northwest of Darwin. Joan's movement in the following 48 hours was towards the southwest at an average 5 km/h. The first evidence of the increasing strength of Joan came as the cyclone moved west-southwest past the northernmost areas of Western Australia on December 3. The cyclone's generally west-southwesterly track after December 2 took it away from the coast until 0900 6 December when it was about 420 km north of Port Hedland and the system turned southward. At about 2200 UTC December 7, 1975, the eye of tropical cyclone Joan crossed the coast about 50 km west of Port Hedland. The cyclone was travelling south-southwest at about 14 km/h and crossed over or adjacent to the homesteads on the pastoral properties Mundabullangana, Mallina, Coolawanyah, Hamersley, and Mount Brockman. As cyclone Joan crossed the coastal plain and the Chichester Range only a slow moderation of its intensity seems to have occurred, but as the cyclone crossed the Hamersley Range the available evidence suggests that a rapid weakening took place.
Tropical cyclone Joan was the most destructive cyclone to affect the Port Hedland area in more than 30 years. The city was subjected to sustained winds exceeding 90 km/h for about 10 hours with winds in excess of 120 km/h for three hours. The maximum measured wind gust of 208 km/h on December 8, 1975, is the fourth highest on record in Australia. Severe property damage occurred at Port Hedland and at other settlements close to the cyclone's path. Subsequent flooding damaged roads and sections of the iron ore railways, particularly that of Hamersley Iron Pty Ltd. Sheep losses were heavy but, remarkably, no loss of human life or serious injury was reported. The estimated damage to private property and public facilities is believed to have exceeded $25 million.
[1]
Tropical Cyclone Kim
| Category 1 tropical cyclone (Australian scale) |
| Tropical storm (SSHWS) |
|
|
| Duration |
December 1 – December 10 |
| Peak intensity |
80 km/h (50 mph) (10-min) 990 hPa (mbar) |
Tropical Cyclone Barbara
| Tropical cyclone (MFR) |
| Category 1 tropical cyclone (SSHWS) |
|
|
| Duration |
December 3 – December 19 |
| Peak intensity |
120 km/h (75 mph) (10-min) |
Tropical Cyclone Sue
| Category 1 tropical cyclone (Australian scale) |
| Tropical storm (SSHWS) |
|
|
| Duration |
December 12 – December 16 |
| Peak intensity |
75 km/h (45 mph) (10-min) 994 hPa (mbar) |
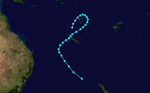
Moderate Tropical Storm Clotilde
| Moderate tropical storm (MFR) |
| Category 1 tropical cyclone (SSHWS) |
|
|
| Duration |
January 7 – January 21 |
| Peak intensity |
65 km/h (40 mph) (10-min) |
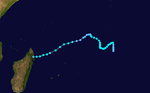
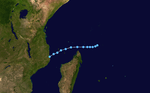
Intense Tropical Cyclone Terry-Danae
| Intense tropical cyclone (MFR) |
| Category 3 tropical cyclone (SSHWS) |
|
|
| Duration |
January 10 – January 29 |
| Peak intensity |
175 km/h (110 mph) (10-min) 964 hPa (mbar) |
Cyclone Danae struck Madagascar and then hit the east coast of Mozambique and South Africa in late January 1976. 50 people were killed in the flooding that resulted from the heavy rainfall of Cyclone Danae.
WeatherSA Home: Johannesburg
Severe Tropical Cyclone David
| Category 3 severe tropical cyclone (Australian scale) |
| Category 2 tropical cyclone (SSHWS) |
|
|
| Duration |
January 11 – January 22 |
| Peak intensity |
150 km/h (90 mph) (10-min) 961 hPa (mbar) |
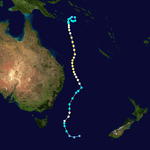
Severe Tropical Cyclone Vanessa
| Category 4 severe tropical cyclone (Australian scale) |
| Category 3 tropical cyclone (SSHWS) |
|
|
| Duration |
January 15 – January 28 |
| Peak intensity |
175 km/h (110 mph) (10-min) 950 hPa (mbar) |
Tropical Cyclone Elsa
| Category 2 tropical cyclone (Australian scale) |
| Tropical storm (SSHWS) |
|
|
| Duration |
January 20 – January 26 |
| Peak intensity |
100 km/h (65 mph) (10-min) 980 hPa (mbar) |
Tropical Cyclone Alan
| Category 2 tropical cyclone (Australian scale) |
| Tropical storm (SSHWS) |
|
|
| Duration |
January 30 – February 9 |
| Peak intensity |
95 km/h (60 mph) (10-min) 989 hPa (mbar) |
Severe Tropical Cyclone Frances
| Category 3 severe tropical cyclone (Australian scale) |
| Category 1 tropical cyclone (SSHWS) |
|
|
| Duration |
February 2 – February 10 |
| Peak intensity |
130 km/h (80 mph) (10-min) 965 hPa (mbar) |
Severe Tropical Cyclone Beth
| Category 3 severe tropical cyclone (Australian scale) |
| Category 1 tropical cyclone (SSHWS) |
|
|
| Duration |
February 13 – February 22 |
| Peak intensity |
130 km/h (80 mph) (10-min) 972 hPa (mbar) |
Severe Tropical Cyclone Wally
| Category 3 severe tropical cyclone (Australian scale) |
| Category 1 tropical cyclone (SSHWS) |
|
|
| Duration |
February 22 – February 27 |
| Peak intensity |
130 km/h (80 mph) (10-min) 973 hPa (mbar) |
Severe Tropical Cyclone Colin
| Category 3 severe tropical cyclone (Australian scale) |
| Category 2 tropical cyclone (SSHWS) |
|
|
| Duration |
February 25 – March 7 |
| Peak intensity |
155 km/h (100 mph) (10-min) 954 hPa (mbar) |
Tropical Cyclone Alice
| Category 1 tropical cyclone (Australian scale) |
| Tropical storm (SSHWS) |
|
|
| Duration |
March 2 – March 13 |
| Peak intensity |
85 km/h (50 mph) (10-min) 988 hPa (mbar) |
Tropical Cyclone Dawn
| Category 1 tropical cyclone (Australian scale) |
| Tropical storm (SSHWS) |
|
|
| Duration |
March 3 – March 6 |
| Peak intensity |
75 km/h (45 mph) (10-min) 988 hPa (mbar) |
Tropical Depression George
| Tropical depression (Australian scale) |
|
|
| Duration |
March 9 – March 13 |
| Peak intensity |
30 km/h (15 mph) (10-min) 1006 hPa (mbar) |
Tropical Cyclone Hope
| Category 1 tropical cyclone (Australian scale) |
| Tropical storm (SSHWS) |
|
|
| Duration |
March 9 – March 19 |
| Peak intensity |
75 km/h (45 mph) (10-min) 990 hPa (mbar) |
Tropical Depression Ella
| Tropical depression (SSHWS) |
|
|
| Duration |
March 9 – March 12 |
| Peak intensity |
55 km/h (35 mph) (1-min) |
Tropical Low Linda
| Tropical low (Australian scale) |
| Tropical storm (SSHWS) |
|
|
| Duration |
March 14 – March 17 |
| Peak intensity |
55 km/h (35 mph) (10-min) 995 hPa (mbar) |
Tropical Disturbance Frederique
| Tropical disturbance (MFR) |
| Tropical depression (SSHWS) |
|
|
| Duration |
March 25 – March 26 |
| Peak intensity |
45 km/h (30 mph) (10-min) |
1976–1977 Southern Hemisphere tropical cyclone season
Tropical Cyclone Harry
| Severe tropical storm (MFR) |
| Tropical storm (SSHWS) |
|
|
| Duration |
December 15 – December 21 |
| Peak intensity |
100 km/h (65 mph) (10-min) 985 hPa (mbar) |
Harry formed on December 15 near the Sunda Strait, and moved west-southwest through its existence. Its maximum intensity was reached as the cyclone passed north of the Cocos-Keeling Islands. The system then weakened and dissipated well east of Madagascar.[2]
Cyclone Ted
Ted made landfall in Queensland on January 1, 1977. The storm killed 2 people and left $49 million in damage.[3]
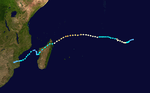
Cyclone Emilie
Cyclone Emilie struck the east coast of Mozambique and northeastern South Africa in February 1977. Heavy flooding in the Limpopo Valley killed at least 300 people.
Cyclone Otto
Otto made landfall near Bowen, Queensland in March 1977. The storm caused minimal wind damage but caused extensive beach erosion.[4]
Cyclone Leo
Leo affected Port Hedland around March 1977.
1977–1978 Southern Hemisphere tropical cyclone season
1978–1979 Southern Hemisphere tropical cyclone season
1979–1980 Southern Hemisphere tropical cyclone season
See also
External links
References