United Kingdom general election, 2010 (Cornwall)
| | ||||||||||||||||||||||||||||||||||||||||||||
| ||||||||||||||||||||||||||||||||||||||||||||
| ||||||||||||||||||||||||||||||||||||||||||||
|
| ||||||||||||||||||||||||||||||||||||||||||||
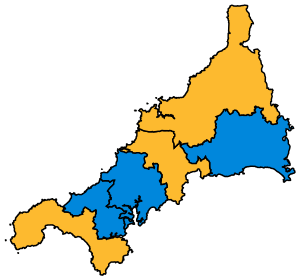
| Constituency map of Cornwall, coloured by winning party | ||||||||||||||||||||||||||||||||||||||||||||
| ||||||||||||||||||||||||||||||||||||||||||||
The results of the 2010 United Kingdom general election in Cornwall were all announced on Friday 7 May 2010. Cornwall received one new constituency for this election, bringing the total to six, after boundary changes issued by the Boundary Commission for England.
Overall results
| Party | MPs | +/- | Votes | % | +/-% | |
| Liberal Democrats | 3 | -3 | 117,307 | 41.8 | -2.6 | |
| Conservative Party | 3 | +3 | 115,016 | 40.9 | +9.1 | |
| Labour Party | 0 | 24,257 | 8.6 | -7.3 | ||
| UKIP | 0 | 13,763 | 4.9 | -0.1 | ||
| Mebyon Kernow | 0 | 5,379 | 1.9 | +0.5 | ||
| Green Party | 0 | 3,573 | 1.3 | +0.6 | ||
| British National Party | 0 | 1,022 | 0.4 | +0.4 | ||
| Cornish Democrats | 0 | 396 | 0.1 | +0.1 | ||
| Socialist Labour Party | 0 | 168 | 0.1 | +0.1 | ||
Seat by seat

Constituency map of Cornwall, showing constituency names
As a result of the creation of three new constituencies in Cornwall and boundary changes of the remaining three since the 2005 general election, notional results are used to estimate the previous party MP.[2]
| Constituency | Party | MP | Majority | Result | Swing | |
| Camborne & Redruth | Conservative | George Eustice | 66 | Conservative gain from Lib Dem | 5.2% from Liberal Democrats to Conservative | |
| North Cornwall | Liberal Democrat | Dan Rogerson | 2,981 | Lib Dem hold | 0.3% from Liberal Democrats to Conservative | |
| South East Cornwall | Conservative | Sheryll Murray | 3,220 | Conservative gain from Lib Dem | 9.1% from Liberal Democrats to Conservative | |
| St Austell & Newquay | Liberal Democrat | Steve Gilbert | 1,312 | Lib Dem hold | 4.8% from Liberal Democrats to Conservative | |
| St Ives | Liberal Democrat | Andrew George | 1,719 | Lib Dem hold | 10.4% from Liberal Democrats to Conservative | |
| Truro & Falmouth | Conservative | Sarah Newton | 435 | Conservative gain from Lib Dem | 5.0% from Liberal Democrats to Conservative | |
Results by constituency
St Ives
Truro and Falmouth
South East Cornwall
|
Camborne and Redruth
St Austell and Newquay
North Cornwall
| |||||||||||||||||||||||||||||||||||||||||||||||||||||||||||||||||||||||||||||||||||||||||||||||||||||||||||||||||||||||||||||||||||||||||||||||||||||||||||||||||||||||||||||||||||||||||||||||||||||||||||||||||||||||||||||||||||||||||||||||||||||||||||||||||||||||||||||||||||||||||||||||||||||||||||||||||||||||||||||||||||||||||||
See also
References
- ↑ Election 2010 United Kingdom – National Results BBC News
- ↑ "Seats South West". UK Polling Report. Retrieved 12 May 2001.
- ↑ BBC News – Election 2010 Results – St Ives
- ↑ BBC News – Election 2010 Results – Truro & Falmouth
- ↑ BBC News – Election 2010 Results – Cornwall South East
- ↑ BBC News – Election 2010 Results – Camborne & Redruth
- ↑ BBC News – Election 2010 Results – St Austell & Newquay
- ↑ BBC News – Election 2010 Results – Cornwall North
This article is issued from Wikipedia - version of the 9/20/2016. The text is available under the Creative Commons Attribution/Share Alike but additional terms may apply for the media files.


