Aberdeenshire Council election, 2007
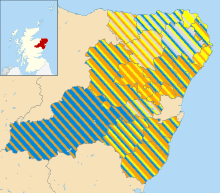
Results by ward.
Elections to Aberdeenshire Council were held on 3 May 2007 the same day as the other Scottish local government elections and the Scottish Parliament general election. The election was the first one using 19 new wards created as a results of the Local Governance (Scotland) Act 2004, each ward will elect three or four councillors using the single transferable vote system a form of proportional representation. The new wards replace 68 single-member wards which used the plurality (first past the post) system of election.
The council remained under no overall control.
Results
Votes are the first preference votes.
| Aberdeenshire Local Election Result 2007 |
| Party |
Seats |
Gains |
Losses |
Net gain/loss |
Seats % |
Votes % |
Votes |
+/− |
| |
Liberal Democrats |
24 |
N/A |
N/A |
–4 |
35.3 |
25.2 |
24,175 |
|
| |
SNP |
22 |
N/A |
N/A |
+7 |
32.4 |
34.5 |
33,120 |
|
| |
Conservative |
14 |
N/A |
N/A |
+3 |
20.6 |
20.8 |
19,946 |
|
| |
Labour |
0 |
N/A |
N/A |
±0 |
0.0 |
5.4 |
5,189 |
|
| |
Scottish Green |
0 |
N/A |
N/A |
±0 |
0.0 |
1.1 |
1,097 |
|
| |
Solidarity |
0 |
N/A |
N/A |
±0 |
0.0 |
0.1 |
112 |
|
| |
BNP |
0 |
N/A |
N/A |
±0 |
0.0 |
0.1 |
87 |
|
| |
Independent |
8 |
N/A |
N/A |
–6 |
11.8 |
12.7 |
12,182 |
|
Ward results
Banff and District (3 seats)
| Banff and District |
| Party | Candidate | % 1st Pref | Count 1 | Count 2 | Count 3 | Count 4 | Count 5 | Count 6 | Count 7 | Count 8 |
|
SNP |
Ian Gray |
24.0 |
1,088 |
1,092 |
1,103 |
1,142 |
|
|
|
|
|
Liberal Democrats |
Jack Mair |
15.3 |
694 |
704 |
713 |
773 |
773 |
848 |
915 |
1,132 |
|
Independent |
John Cox†††††††† |
15.2 |
691 |
707 |
742 |
791 |
791 |
925 |
1,055 |
1,257 |
|
Conservative |
Neil Chalmers |
13.6 |
616 |
626 |
640 |
666 |
666 |
741 |
792 |
|
|
SNP |
Kathryn Parr |
11.0 |
500 |
509 |
525 |
554 |
558 |
609 |
|
|
|
Independent |
Sandy Buchan |
8.4 |
383 |
398 |
438 |
475 |
475 |
|
|
|
|
Scottish Green |
Jonny Barton |
6.6 |
298 |
301 |
319 |
|
|
|
|
|
|
Independent |
John Calder |
3.8 |
172 |
180 |
|
|
|
|
|
|
|
Independent |
Ian Page |
2.1 |
94 |
|
|
|
|
|
|
|
| Electorate: - Valid: 4,536 Spoilt: 105 Quota: 1,135 Turnout: 53.11% |
Troup (3 seats)
| Troup |
| Party | Candidate | % 1st Pref | Count 1 | Count 2 |
|
SNP |
Mitchell Burnett |
47.7 |
1,798 |
|
|
Conservative |
John Duncan |
24.3 |
914 |
1,060 |
|
Independent |
Sydney Mair |
20.4 |
770 |
975 |
|
Liberal Democrats |
Ian Findlay |
7.6 |
286 |
422 |
| Electorate: - Valid: 3,768 Spoilt: 53 Quota: 943 Turnout: 50.91% |
Fraserburgh and District (4 seats)
| Fraserburgh and District |
| Party | Candidate | % 1st Pref | Count 1 | Count 2 | Count 3 | Count 4 | Count 5 | Count 6 | Count 7 |
|
SNP |
Brian Topping |
27.1 |
1,487 |
|
|
|
|
|
|
|
SNP |
Ian Tait† |
20.6 |
1,131 |
|
|
|
|
|
|
|
Independent |
Michael Watt |
15.1 |
831 |
865 |
869 |
890 |
918 |
1,041 |
1,370 |
|
SNP |
Andy Ritchie†††††† |
14.5 |
795 |
1,022 |
1,037 |
1,046 |
1,060 |
1,090 |
1,165 |
|
Independent |
Dennis Duthie |
9.3 |
509 |
520 |
522 |
554 |
587 |
728 |
|
|
Conservative |
Bob Sim |
8.5 |
466 |
482 |
484 |
490 |
522 |
|
|
|
Liberal Democrats |
Dominique-Paul Lonchay |
3.0 |
164 |
167 |
168 |
171 |
|
|
|
|
Independent |
James Milne |
2.0 |
109 |
116 |
116 |
|
|
|
|
| Electorate: - Valid: 5,492 Spoilt: 168 Quota: 1,099 Turnout: 51.83% |
Central Buchan (4 seats)
| Central Buchan |
| Party | Candidate | % 1st Pref | Count 1 | Count 2 | Count 3 | Count 4 | Count 5 | Count 6 | Count 7 | Count 8 |
|
SNP |
Sandy Stronach |
20.2 |
1,096 |
|
|
|
|
|
|
|
|
Independent |
Norman Smith |
19.4 |
1,054 |
1,054 |
1,080 |
1,142 |
|
|
|
|
|
Conservative |
Peter Chapman |
17.2 |
933 |
933 |
974 |
1,022 |
1,031 |
1,087 |
|
|
|
Independent |
Albert Howe |
14.6 |
790 |
790 |
822 |
911 |
933 |
1,016 |
1,016 |
1,283 |
|
SNP |
Norma Thomson |
13.2 |
718 |
726 |
771 |
804 |
812 |
870 |
870 |
|
|
Labour |
Carol Donald |
5.9 |
318 |
318 |
363 |
378 |
381 |
|
|
|
|
Independent |
Jim Conn |
4.9 |
265 |
265 |
290 |
|
|
|
|
|
|
Liberal Democrats |
Betty May |
4.7 |
253 |
253 |
|
|
|
|
|
|
| Electorate: - Valid: 5,427 Spoilt: 91 Quota: 1,086 Turnout: 55.42% |
Peterhead North and Rattray (4 seats)
| Peterhead North and Rattray |
| Party | Candidate | % 1st Pref | Count 1 | Count 2 | Count 3 | Count 4 | Count 5 | Count 6 | Count 7 |
|
SNP |
Anne Allan |
22.4 |
1,018 |
|
|
|
|
|
|
|
Independent |
Alan Buchan |
20.9 |
948 |
948 |
|
|
|
|
|
|
SNP |
Fiona McRae |
15.0 |
682 |
696 |
699 |
713 |
735 |
763 |
1,316 |
|
Conservative |
Robert Thomas |
14.4 |
655 |
655 |
659 |
667 |
704 |
803 |
819 |
|
SNP |
Sandy Allan |
12.9 |
585 |
666 |
671 |
685 |
718 |
752 |
|
|
Liberal Democrats |
Andrew Hassan |
6.3 |
288 |
290 |
292 |
304 |
356 |
|
|
|
Independent |
Ian Cowie |
5.6 |
256 |
257 |
265 |
289 |
|
|
|
|
Solidarity |
Steven Will |
2.5 |
112 |
113 |
115 |
|
|
|
|
| Electorate: - Valid: 4,544 Spoilt: 150 Quota: 909 Turnout: 46.04% |
Peterhead South and Cruden (3 seats)
| Peterhead South and Cruden |
| Party | Candidate | % 1st Pref | Count 1 | Count 2 | Count 3 | Count 4 | Count 5 |
|
SNP |
Stephen Smith |
29.4 |
1,205 |
|
|
|
|
|
SNP |
Stuart Pratt |
21.6 |
888 |
1,016 |
1,032 |
|
|
|
Liberal Democrats |
Sam Coull†††† |
21.0 |
861 |
870 |
894 |
895 |
1,032 |
|
Independent |
Raymond Matthew |
13.0 |
535 |
542 |
637 |
638 |
767 |
|
Conservative |
Steven Owen |
10.3 |
422 |
425 |
443 |
443 |
|
|
Independent |
Veronica Johnston |
4.7 |
193 |
196 |
|
|
|
| Electorate: - Valid: 4,104 Spoilt: 108 Quota: 1,027 Turnout: 48.11% |
Turriff and District (3 seats)
| Turriff and District |
| Party | Candidate | % 1st Pref | Count 1 | Count 2 | Count 3 | Count 4 | Count 5 |
|
SNP |
Sandy Duncan |
41.9 |
1,916 |
|
|
|
|
|
Conservative |
Alistair Duffus Strachan |
17.4 |
796 |
882 |
901 |
932 |
|
|
Liberal Democrats |
Anne Robertson |
17.3 |
790 |
948 |
962 |
1,071 |
1,372 |
|
Independent |
Alisan Norrie |
16.4 |
748 |
900 |
935 |
971 |
1,304 |
|
Labour |
Ann Marie Sheal |
5.1 |
232 |
270 |
279 |
|
|
|
BNP |
Gary Raikes |
1.9 |
87 |
119 |
|
|
|
| Electorate: - Valid: 4,569 Spoilt: 52 Quota: 1,143 Turnout: 53.53% |
Mid-Formartine (4 seats)
| Mid-Formartine |
| Party | Candidate | % 1st Pref | Count 1 | Count 2 | Count 3 | Count 4 | Count 5 |
|
SNP |
Allan Hendry |
33.6 |
2,035 |
|
|
|
|
|
Liberal Democrats |
Paul Johnston††††† |
27.4 |
1,661 |
|
|
|
|
|
Conservative |
Jim Gifford |
17.1 |
1,034 |
1,141 |
1,182 |
1,261 |
|
|
Liberal Democrats |
John Kevin Loveday |
11.2 |
677 |
855 |
1,134 |
1,210 |
1,227 |
|
Labour |
Steve Thomson |
7.7 |
469 |
558 |
586 |
613 |
618 |
|
Independent |
Howard Kershaw |
3.1 |
188 |
290 |
306 |
|
|
| Electorate: - Valid: 6,064 Spoilt: 59 Quota: 1,213 Turnout: 55.91% |
Ellon and District (4 seats)
| Ellon and District |
| Party | Candidate | % 1st Pref | Count 1 | Count 2 | Count 3 | Count 4 | Count 5 |
|
SNP |
Rob Merson |
40.5 |
2,458 |
|
|
|
|
|
Liberal Democrats |
Isobel Davidson |
23.2 |
1,407 |
|
|
|
|
|
Conservative |
Gillian Louise Owen |
14.4 |
872 |
1,033 |
1,053 |
1,197 |
1,274 |
|
Liberal Democrats |
Debra Margaret Storr†† |
8.6 |
524 |
777 |
899 |
1,049 |
1,326 |
|
Labour |
Ann Thorpe |
7.5 |
456 |
587 |
599 |
648 |
|
|
Independent |
Diane Ripley |
5.8 |
352 |
542 |
555 |
|
|
| Electorate: - Valid: 6,069 Spoilt: 69 Quota: 1,214 Turnout: 55.37% |
West Garioch (3 seats)
| West Garioch |
| Party | Candidate | % 1st Pref | Count 1 | Count 2 | Count 3 | Count 4 | Count 5 | Count 6 |
|
SNP |
Alison Grant |
35.5 |
1,555 |
|
|
|
|
|
|
Liberal Democrats |
Sheena Margaret Lonchay |
22.2 |
973 |
1,063 |
1,085 |
1,169 |
|
|
|
Liberal Democrats |
Hazel Al-Kowarri |
18.4 |
807 |
884 |
899 |
981 |
1,027 |
1,358 |
|
Conservative |
David Clucas |
15.8 |
694 |
746 |
775 |
821 |
830 |
|
|
Labour |
Ricky Simpson |
6.0 |
263 |
293 |
303 |
|
|
|
|
Independent |
Terry Rigby |
2.1 |
93 |
125 |
|
|
|
|
| Electorate: - Valid: 4,385 Spoilt: 58 Quota: 1,097 Turnout: 55.68% |
Inverurie and District (4 seats)
| Inverurie and District |
| Party | Candidate | % 1st Pref | Count 1 | Count 2 | Count 3 | Count 4 | Count 5 | Count 6 |
|
SNP |
Bryan Hunter Stuart |
29.6 |
1,515 |
|
|
|
|
|
|
Liberal Democrats |
Mike Raeburn |
25.7 |
1,316 |
|
|
|
|
|
|
Liberal Democrats |
Martin Kitts-Hayes |
16.9 |
865 |
975 |
1,172 |
|
|
|
|
Conservative |
Richard Cowling |
14.9 |
762 |
823 |
837 |
864 |
928 |
1,190 |
|
Labour |
Ellis Thorpe |
11.1 |
567 |
637 |
659 |
693 |
737 |
|
|
Independent |
John Sangster |
1.7 |
87 |
165 |
175 |
192 |
|
|
| Electorate: - Valid: 5,148 Spoilt: 86 Quota: 1,030 Turnout: 56.32% |
East Garioch (3 seats)
| East Garioch |
| Party | Candidate | % 1st Pref | Count 1 | Count 2 | Count 3 | Count 4 |
|
SNP |
Fergie Hood |
31.9 |
1,420 |
|
|
|
|
Liberal Democrats |
Martin Anthony Ford††† |
23.7 |
1,054 |
1,118 |
|
|
|
Liberal Democrats |
Nan Cullinane |
21.8 |
968 |
1,025 |
1,030 |
1,206 |
|
Conservative |
Gordon Naismith |
15.5 |
687 |
726 |
726 |
769 |
|
Labour |
Sheila Henderson |
7.1 |
317 |
345 |
345 |
|
| Electorate: Valid: 4,446 Spoilt: 56 Quota: 1,112 Turnout: 54.94% |
Westhill and District (4 seats)
| Westhill and District |
| Party | Candidate | % 1st Pref | Count 1 | Count 2 | Count 3 | Count 4 | Count 5 | Count 6 |
|
Liberal Democrat |
Gurudeo Singh Saluja |
27.3 |
1,558 |
|
|
|
|
|
|
Conservative |
Ron McKail |
22.9 |
1,306 |
|
|
|
|
|
|
SNP |
Amanda Allan |
21.6 |
1,230 |
|
|
|
|
|
|
Independent |
Mark Cullen†††††††† |
14.8 |
845 |
896 |
945 |
967 |
1,031 |
1,407 |
|
Liberal Democrats |
Sheila Thomson |
8.1 |
460 |
736 |
774 |
794 |
935 |
|
|
Labour |
Ona Ramsay |
5.3 |
301 |
325 |
333 |
344 |
|
|
| Electorate: Valid: 5,700 Spoilt: 39 Quota: 1,141 Turnout: 55.00% |
Huntly, Strathbogie and Howe of Alford (4 seats)
| Huntly, Strathbogie and Howe of Alford |
| Party | Candidate | % 1st Pref | Count 1 | Count 2 | Count 3 | Count 4 | Count 5 | Count 6 | Count 7 |
|
SNP |
Joanna Strathdee |
30.7 |
1,839 |
|
|
|
|
|
|
|
Conservative |
Moira Ingleby |
27.3 |
1,635 |
|
|
|
|
|
|
|
Liberal Democrats |
Richard C Stroud |
16.4 |
978 |
1,077 |
1,145 |
1,170 |
1,280 |
|
|
|
Liberal Democrats |
Alistair Ross |
13.6 |
812 |
907 |
979 |
1,012 |
1,088 |
1,143 |
1,378 |
|
Labour |
Bryan Begg |
6.3 |
375 |
424 |
444 |
456 |
501 |
508 |
|
|
Scottish Green |
Jake Williams |
4.2 |
251 |
340 |
376 |
421 |
|
|
|
|
Independent |
David Hutchison |
1.5 |
91 |
135 |
177 |
|
|
|
|
| Electorate: Valid: 5,981 Spoilt: 82 Quota: 1,197 Turnout: 54.68% |
Aboyne, Upper Deeside and Donside (3 seats)
| Aboyne, Upper Deeside and Donside |
| Party | Candidate | % 1st Pref | Count 1 | Count 2 | Count 3 | Count 4 | Count 5 |
|
Conservative |
Marcus Humphrey |
29.3 |
1,444 |
|
|
|
|
|
Liberal Democrats |
Peter Argyle |
26.1 |
1,286 |
|
|
|
|
|
Conservative |
Bruce Luffman |
20.5 |
1,009 |
1,160 |
1,172 |
1,218 |
1,625 |
|
SNP |
Carol Douglas |
20.1 |
991 |
1,009 |
1,021 |
1,078 |
|
|
Labour |
Angus Murdoch |
4.0 |
196 |
202 |
213 |
|
|
| Electorate: Valid: 4,926 Spoilt: 75 Quota: 1,232 Turnout: 59.51% |
Banchory and Mid-Deeside (3 seats)
| Banchory and Mid-Deeside |
| Party | Candidate | % 1st Pref | Count 1 | Count 2 | Count 3 | Count 4 | Count 5 |
|
Conservative |
Jill Webster |
35.6 |
1,570 |
|
|
|
|
|
SNP |
Linda Clark |
24.2 |
1,068 |
1,140 |
|
|
|
|
Liberal Democrats |
Karen Clark |
18.0 |
795 |
876 |
885 |
1,029 |
1,691 |
|
Liberal Democrats |
Jean Henretty |
15.3 |
300 |
790 |
798 |
857 |
|
|
Labour |
Andy Brown |
6.8 |
300 |
326 |
331 |
|
|
| Electorate: Valid: 4,409 Spoilt: 46 Quota: 1,103 Turnout: 56.32% |
North Kincardine (4 seats)
| North Kincardine |
| Party | Candidate | % 1st Pref | Count 1 | Count 2 | Count 3 | Count 4 | Count 5 | Count 6 | Count 7 |
|
SNP |
Alastair Bews |
27.8 |
1,426 |
|
|
|
|
|
|
|
Conservative |
Carl H Nelson |
18.4 |
946 |
972 |
1,008 |
1,065 |
|
|
|
|
Liberal Democrats |
Paul Melling |
16.8 |
864 |
957 |
978 |
1,124 |
|
|
|
|
Liberal Democrats |
Ian Mollison |
12.1 |
619 |
652 |
689 |
799 |
863 |
875 |
1,119 |
|
Independent |
Henry Irvine-Fortescue |
11.2 |
575 |
613 |
659 |
707 |
713 |
723 |
|
|
Labour |
Jim Milne |
10.5 |
540 |
586 |
596 |
|
|
|
|
|
Independent |
Michelle Reid-Hay |
3.2 |
162 |
194 |
|
|
|
|
|
| Electorate: Valid: 5,132 Spoilt: 37 Quota: 1,027 Turnout: 52.36% |
Stonehaven and Lower Deeside (4 seats)
| Stonehaven and Lower Deeside |
| Party | Candidate | % 1st Pref | Count 1 | Count 2 | Count 3 | Count 4 | Count 5 | Count 6 | Count 7 | Count 8 | Count 9 | Count 10 | Count 11 |
|
Conservative |
Wendy Agnew |
24.9 |
1,433 |
|
|
|
|
|
|
|
|
|
|
|
SNP |
Graeme Clark |
18.9 |
1,086 |
1,107 |
1,112 |
1,117 |
1,126 |
1,154 |
|
|
|
|
|
|
Liberal Democrats |
Mike Sullivan |
11.0 |
636 |
656 |
657 |
668 |
684 |
700 |
701 |
741 |
797 |
931 |
1,105 |
|
Conservative |
Sandy Wallace |
10.9 |
629 |
730 |
735 |
737 |
751 |
760 |
760 |
779 |
823 |
853 |
|
|
Liberal Democrats |
Peter Bellarby |
9.8 |
563 |
590 |
596 |
605 |
620 |
633 |
633 |
723 |
780 |
880 |
980 |
|
Labour |
Bridget O'Hare |
8.0 |
463 |
470 |
473 |
479 |
482 |
493 |
493 |
524 |
558 |
|
|
|
Independent |
Bob Michie |
4.9 |
282 |
299 |
314 |
333 |
366 |
430 |
430 |
470 |
|
|
|
|
Scottish Green |
Karen Anne Allan |
4.2 |
242 |
253 |
258 |
264 |
272 |
285 |
286 |
|
|
|
|
|
Independent |
George Alexander Forbes Emslie |
2.8 |
160 |
177 |
182 |
189 |
201 |
|
|
|
|
|
|
|
Independent |
Ken Venters |
1.9 |
108 |
116 |
132 |
139 |
|
|
|
|
|
|
|
|
Independent |
Dermot John Hearty |
1.5 |
85 |
87 |
89 |
|
|
|
|
|
|
|
|
|
Independent |
David Wood |
1.3 |
73 |
79 |
|
|
|
|
|
|
|
|
|
| Electorate: Valid: 5,760 Spoilt: 90 Quota: 1,153 Turnout: 54.79% |
Mearns (4 seats)
| Mearns |
| Party | Candidate | % 1st Pref | Count 1 | Count 2 | Count 3 | Count 4 | Count 5 | Count 6 | Count 7 | Count 8 |
|
SNP |
Jean Dick |
23.0 |
1,262 |
|
|
|
|
|
|
|
|
Conservative |
George Carr |
20.5 |
1,123 |
|
|
|
|
|
|
|
|
Liberal Democrats |
Tom Fleming |
16.6 |
909 |
940 |
945 |
1,046 |
1,144 |
|
|
|
|
Liberal Democrats |
Bill Howatson |
13.8 |
759 |
775 |
778 |
815 |
850 |
879 |
1,021 |
1,291 |
|
Labour |
Gill Bayfield |
7.1 |
392 |
406 |
407 |
442 |
455 |
459 |
|
|
|
Independent |
David Nelson |
7.1 |
391 |
404 |
407 |
432 |
596 |
601 |
659 |
|
|
Independent |
Robert Gairn Davidson |
6.2 |
342 |
355 |
358 |
403 |
|
|
|
|
|
Scottish Green |
Kate Anderson |
5.6 |
306 |
336 |
338 |
|
|
|
|
|
| Electorate: Valid: 5,484 Spoilt: 48 Quota: 1,097 Turnout: 53.28% |
Changes Since 2007 Elections
- †Cllr Ian Tait resigned from the SNP on 28 July 2008 and now sits as an Independent Scottish Nationalist.
- ††Cllr Debra Storr resigned from the Liberal Democrats on 18 November 2008 and on 5 March 2009 she joined the Scottish Green Party. She was a member of the Democratic Independent Group on the Council.
- †††Cllr Martin Ford resigned from the Liberal Democrats on 23 November 2008 and on 5 March 2009 he joined the Scottish Green Party. He is a member of the Democratic Independent Group on the Council.
- ††††On 23 January 2009, Cllr Sam Coull resigned from the Liberal Democrats. Since 5 March 2009 he sits as a member of the Democratic Independent Group
- †††††On 23 January 2009, Cllr Paul Johnston left the Liberal Democrat Council Group. He was subsequently expelled from the Liberal Democrats. Since 5 March 2009 he sits as a member of the Democratic Independent Group.
- ††††††Cllr Andy Ritchie resigned from the SNP on 1 April 2009 and now sits as an Independent.
- †††††††Cllr Mark Cullen is also a member of the Democratic Independent Group on the Council.
- ††††††††On 21 February 2012 Banff and District Cllr John Cox ceased to be an Independent and joined the Scottish National Party.
By-elections (2007-12)
- There was a Troup by-election held on 1 May 2008 to fill the vacancy which arose with the death of the SNP's Michael Burnett on 4 February 2008. The by-election was won by the SNP's Bob Watson on 1 May 2008
| Troup by-election, 1 May 2008[1] |
| Party | Candidate | % 1st Pref | Count 1 |
|
SNP |
Bob Watson |
62.83 |
1,721 |
|
Conservative |
Lisa Watt |
18.80 |
515 |
|
Liberal Democrats |
Edward Acton |
18.36 |
503 |
|
SNP hold |
Swing |
|
|
| Electorate: 7,589 Valid: 2,739 Spoilt: 16 Quota: 1,371 Turnout: 2,755 (36.3%) |
- There was an Aboyne, Upper Deeside and Donside by-election held on 23 April 2009 to fill the vacancy which arose with the resignation of the Conservative's Bruce Luffman in 2009. The by-election was won by the Liberal Democrat's Rosemary Bruce on 23 April 2009
| Aboyne, Upper Deeside and Donside by-election, 23 April 2009[2] |
| Party | Candidate | % 1st Pref | Count 1 | Count 2 | Count 3 | Count 4 | Count 5 |
|
Conservative |
Jo Pick |
31.47 |
1,144 |
1,148 |
1,152 |
1,241 |
1,468 |
|
Liberal Democrats |
Rosemary Bruce |
26.66 |
969 |
975 |
981 |
1,180 |
1,566 |
|
Independent |
William Forbes |
23.16 |
842 |
845 |
855 |
1,003 |
|
|
SNP |
George Parkinson |
16.97 |
617 |
621 |
636 |
|
|
|
BNP |
Roy Jones |
1.21 |
44 |
44 |
|
|
|
|
Independent |
David Hutchison |
0.52 |
19 |
|
|
|
|
|
Liberal Democrats gain from Conservative |
Swing |
|
|
| Electorate: 8,357 Valid: 3,635 Spoilt: 20 Quota: 1,819 Turnout: 3,655 (43.7%) |
Footnotes
- ↑ "Archived copy" (PDF). Archived from the original (PDF) on 16 March 2012. Retrieved 2011-05-20.
- ↑ "Archived copy" (PDF). Archived from the original (PDF) on 16 March 2012. Retrieved 2011-05-20.
External links