Alberta municipal censuses, 2014
| | ||||
| ||||
|
| ||||
|
| ||||
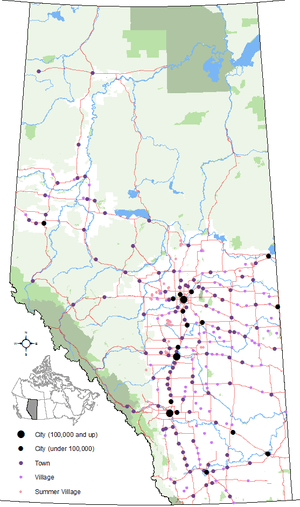
| Distribution of Alberta's 269 urban municipalities | ||||
Alberta has provincial legislation allowing its municipalities to conduct municipal censuses between April 1 and June 30 inclusive.[1][2] Municipalities choose to conduct their own censuses for multiple reasons such as: to better inform municipal service planning and provision; to capitalize on per capita based grant funding from higher levels of government; or to simply update their populations since the last federal census.[3]
Alberta had 357 municipalities between April 1 and June 30, 2014, down from 358 as at June 30, 2013,[lower-alpha 1] which marked the closure of the 2014 legislated municipal census period. At least 39 of these municipalities (10.9%) conducted a municipal census in 2014. Alberta Municipal Affairs recognized those conducted by 37 of these municipalities.[5] By municipal status, it recognized those conducted by 13 of Alberta's 17 cities, 18 of 108 towns, 3 of 93 villages, 1 of 51 summer villages and 2 of 64 municipal districts.[5][lower-alpha 2] In addition to those recognized by Municipal Affairs, censuses were conducted by the Town of Drayton Valley and the Municipal District of Lesser Slave River No. 124.[6][7]
Some municipalities achieved population milestones as a result of their 2014 censuses. Airdrie and Cochrane grew beyond the 50,000 and 20,000 marks respectively, while both Beaumont and Cold Lake exceeded 15,000. The towns of Morinville, St. Paul and Raymond surpassed 9,000, 6,000 and 4,000 residents respectively, while the Municipal District (MD) of Lesser Slave River No. 124 exceeded 3,000.
Municipal census results
The following summarizes the results of the numerous municipal censuses conducted in 2014.
| 2014 municipal census summary[5] | 2011 federal census comparison[8][9] | Previous municipal census comparison | |||||||||
|---|---|---|---|---|---|---|---|---|---|---|---|
| Municipality | Status | Census date |
2014 pop. |
2011 pop. |
Absolute growth |
Absolute change |
Annual growth rate |
Prev. pop. [9][10][11][12] |
Prev. census year [9][10][11][12] |
Absolute growth |
Annual growth rate |
| Airdrie | City | April 15, 2014 | 54,891 | 42,564 | 12,327 | 29% | 8.8% | 49,560 | 2013 | 5,331 | 10.8% |
| Banff | Town | June 16, 2014 | 8,421 | 7,584 | 837 | 11% | 3.6% | 7,251 | 2011 | 1,170 | 5.1% |
| Barons | Village | June 16, 2014 | 318 | 315 | 3 | 1% | 0.3% | 326 | 2010 | −8 | 0.6% |
| Beaumont | Town | May 1, 2014 | 15,828 | 13,284 | 2,544 | 19.2% | 6.0% | 14,916 | 2013 | 912 | 6.1% |
| Bentley | Town | May 1, 2014 | 1,122 | 1,073 | 49 | 4.6% | 1.5% | 1,132 | 2009 | −10 | −0.2% |
| Blackfalds | Town | June 30, 2014 | 7,858 | 6,300 | 1,558 | 24.7% | 7.6% | 7,275 | 2013 | 583 | 8.0% |
| Bonnyville | Town | April 1, 2014 | 6,921 | 6,216 | 705 | 11.3% | 3.6% | 6,837 | 2012 | 84 | 0.6% |
| MD of Bonnyville No. 87 | Municipal district | April 1, 2014 | 11,836 | 10,101 | 1,735 | 17.2% | 5.4% | ||||
| Boyle | Village | June 4, 2014 | 948 | 916 | 32 | 3.5% | 1.2% | 918 | 2009 | 30 | 0.6% |
| Bruderheim | Town | April 1, 2014 | 1,348 | 1,155 | 193 | 16.7% | 5.3% | 1,298 | 2012 | 50 | 1.9% |
| Calgary | City | April 1, 2014 | 1,195,194 | 1,096,833 | 98,361 | 9% | 2.9% | 1,156,686[13][lower-alpha 3] | 2013 | 38,508 | 3.3% |
| Calmar | Town | June 7, 2014 | 2,101 | 1,970 | 131 | 6.6% | 2.2% | 2,033 | 2009 | 68 | 0.7% |
| Camrose | City | April 1, 2014 | 18,038 | 17,286 | 752 | 4.4% | 1.4% | 17,236 | 2011 | 802 | 1.5% |
| Canmore | Town | May 21, 2014 | 13,077 | 12,288 | 789 | 6.4% | 2.1% | 12,317 | 2011 | 760 | 2.0% |
| Chestermere | Town | May 1, 2014 | 17,203 | 14,824 | 2,379 | 16% | 5.1% | 15,762 | 2013 | 1,441 | 9.1% |
| Cochrane | Town | April 1, 2014 | 20,708 | 17,580 | 3,128 | 17.8% | 5.6% | 18,750 | 2013 | 1,958 | 10.4% |
| Cold Lake | City | April 1, 2014 | 15,736 | 13,839 | 1,897 | 13.7% | 4.4% | 14,400 | 2012 | 1,336 | 4.5% |
| Crossfield | Town | May 1, 2014 | 2,918 | 2,853 | 65 | 2.3% | 0.8% | 2,861 | 2010 | 57 | 0.5% |
| Devon | Town | June 5, 2014 | 6,650 | 6,510 | 140 | 2.2% | 0.7% | 6,534 | 2009 | 116 | 0.4% |
| Drayton Valley[6] | Town | April 30, 2014 | 7,049 | 6,579 | 2006 | ||||||
| Edmonton | City | April 1, 2014 | 877,926 | 812,201 | 65,725 | 8.1% | 2.6% | 817,498 | 2012 | 60,428 | 3.6% |
| Forestburg | Village | April 15, 2014 | 880 | 831 | 49 | 5.9% | 1.9% | 863 | 2004 | 17 | 0.2% |
| Fort Saskatchewan | City | April 28, 2014 | 22,808 | 19,051 | 3,757 | 19.7% | 6.2% | 21,795 | 2013 | 1,013 | 4.6% |
| Lacombe | City | April 7, 2014 | 12,728 | 11,707 | 1,021 | 8.7% | 2.8% | 11,733 | 2009 | 995 | 1.6% |
| Leduc | City | April 28, 2014 | 28,583 | 24,279 | 4,304 | 17.7% | 5.6% | 27,241 | 2013 | 1,342 | 4.9% |
| MD of Lesser Slave River No. 124[7] | Municipal district | May 1, 2014 | 3,074 | 2,929 | 145 | 5% | 1.6% | 2,840 | 2003 | 234 | 0.7% |
| Lethbridge | City | April 1, 2014 | 93,004 | 83,517 | 9,487 | 11.4% | 3.7% | 90,417 | 2013 | 2,587 | 2.9% |
| Morinville | Town | April 15, 2014 | 9,402 | 8,569 | 833 | 9.7% | 3.1% | 8,504 | 2011 | 898 | 3.4% |
| Okotoks | Town | May 7, 2014 | 27,331 | 24,511 | 2,820 | 11.5% | 3.7% | 26,319 | 2013 | 1,012 | 3.8% |
| Olds | Town | April 9, 2014 | 8,617 | 8,235 | 382 | 4.6% | 1.5% | 8,511 | 2013 | 106 | 1.2% |
| Penhold | Town | May 14, 2014 | 2,842 | 2,375 | 467 | 19.7% | 6.2% | 2,476 | 2012 | 366 | 7.1% |
| Raymond | Town | April 14, 2014 | 4,081 | 3,743 | 338 | 9% | 2.9% | 3,982 | 2013 | 99 | 2.5% |
| Red Deer | City | May 5, 2014 | 98,585 | 90,564 | 8,021 | 8.9% | 2.9% | 97,109 | 2013 | 1,476 | 1.5% |
| Spruce Grove | City | April 1, 2014 | 29,526 | 26,171 | 3,355 | 12.8% | 4.1% | 24,646 | 2010 | 4,880 | 4.6% |
| St. Albert | City | April 7, 2014 | 63,255 | 61,466 | 1,789 | 2.9% | 1.0% | 60,994 | 2012 | 2,261 | 1.8% |
| St. Paul | Town | May 15, 2014 | 6,004 | 5,400 | 604 | 11.2% | 3.6% | 5,844 | 2012 | 160 | 0.7% |
| Waiparous | Summer village | May 21, 2014 | 64 | 42 | 22 | 52.4% | 15.1% | 72 | 2007 | −8 | −1.7% |
| Wetaskiwin | City | May 1, 2014 | 12,621 | 12,525 | 96 | 0.8% | 0.3% | 12,285 | 2009 | 336 | 0.5% |
| Woodlands County | Municipal district | May 1, 2014 | 4,612 | 4,306 | 306 | 7.1% | 2.3% | 2,980 | 1991 | 1,632 | 1.9% |
Breakdowns
Hamlets
The following is a list of hamlets that had populations determined by the 2014 municipal census conducted by their administering municipal districts.
Shadow population counts
Alberta Municipal Affairs defines shadow population as "temporary residents of a municipality who are employed by an industrial or commercial establishment in the municipality for a minimum of 30 days within a municipal census year."[3] The Town of Banff and the MD of Bonnyville No. 87 conducted shadow population counts in 2014. The following presents the results of these counts for comparison with its concurrent municipal census results.
| 2014 municipal census shadow population summary[5] | ||||
|---|---|---|---|---|
| Municipality | Status | Permanent population |
Shadow population |
Combined population |
| Banff | Town | 8,421 | 965 | 9,386 |
| MD of Bonnyville No. 87 | Municipal district | 11,836 | 1,397 | 13,233 |
Notes
- ↑ The Village of Tilley dissolved to become a hamlet under the jurisdiction of the County of Newell on August 31, 2013.[4]
- ↑ No censuses were conducted among Alberta's 5 specialized municipalities, 3 special areas and 8 improvement districts.[5]
- ↑ The City of Calgary's 2013 municipal census population was originally reported as 1,149,552.[14] This population was revised to 1,156,686 in July 2014.[13] The city's revised 2013 census report explains it was "adjusted upward due to a correction to the automated conversion process."[13]
See also
- Alberta municipal elections, 2013
- List of communities in Alberta
- List of mayors in Alberta
- List of municipalities in Alberta
References
- ↑ "Municipal Government Act: Revised Statutes of Alberta 2000 Chapter M-26 (Office Consolidation)". Alberta Queen's Printer. November 24, 2010. Retrieved June 24, 2013.
- ↑ "Municipal Government Act: Determination of Population Regulation, Alberta Regulation 63/2001 (Office Consolidation)" (PDF) (PDF). Alberta Queen’s Printer. 2013. p. 3. Retrieved December 30, 2013.
- 1 2 "Municipal Census Manual: Requirements and Guidelines for Conducting a Municipal Census" (PDF) (PDF). Alberta Municipal Affairs. January 2013. p. 7. ISBN 978-1-4601-0359-3. Retrieved June 24, 2013.
- ↑ "O.C. 250/2013". Alberta Queen's Printer. August 13, 2013. Retrieved December 31, 2013.
- 1 2 3 4 5 "2014 Municipal Affairs Population List" (PDF) (PDF). Alberta Municipal Affairs. ISBN 978-1-4601-2067-5. Retrieved January 31, 2015.
- 1 2 Courtney Whalen (May 5, 2014). "Online municipal census launches next week". Drayton Valley Western Review. Canoe Sun Media. Retrieved January 31, 2015.
- 1 2 "Agenda: Municipal District #124 Council Meeting 2014 Municipal Census Update" (PDF) (PDF). Municipal District of Lesser Slave River No. 124. July 8, 2014. pp. 69 70. Retrieved July 18, 2014.
- ↑ "Population and dwelling counts, for Canada, provinces and territories, and census subdivisions (municipalities), 2011 and 2006 censuses (Alberta)". Statistics Canada. February 8, 2012. Retrieved February 8, 2012.
- 1 2 3 "2013 Municipal Affairs Population List" (PDF) (PDF). Alberta Municipal Affairs. November 20, 2013. ISBN 978-1-4601-1418-6. Retrieved December 4, 2013.
- 1 2 "2011 Municipal Affairs Population List" (PDF) (PDF). Alberta Municipal Affairs. October 5, 2011. ISBN 978-0-7785-9738-4. Retrieved December 28, 2013.
- 1 2 "2006 Official Population List" (PDF) (PDF). Alberta Municipal Affairs. February 5, 2007. ISBN 0-7785-4994-1. Retrieved December 28, 2013.
- 1 2 "Official Population List 1996" (PDF) (PDF). Alberta Municipal Affairs. October 1, 1996. Retrieved December 28, 2013.
- 1 2 3 "2013 Civic Census Results Revised 2014 July" (PDF) (PDF). City of Calgary. July 2014. pp. 3 & 9. Retrieved July 22, 2014.
- ↑ "2013 Civic Census Results" (PDF) (PDF). City of Calgary. July 2013. p. 3. Retrieved July 22, 2014.
- 1 2 3 4 5 6 "MD of Bonnyville 2014 Census Results" (PDF). Municipal District of Bonnyville No. 87. p. 1. Retrieved February 1, 2015.
External links
- Alberta Municipal Affairs: Municipal Census & Population Lists
- Statistics Canada: Census Profile (2011 Census)