Austrian legislative election, 2013
| | ||||||||||||||||||||||||||||||||||||||||||||||||||||||||||||||||||||||||||||||||||||||||||||||||||||||||||||||||||||||||||||||||||||||||||||||||
| ||||||||||||||||||||||||||||||||||||||||||||||||||||||||||||||||||||||||||||||||||||||||||||||||||||||||||||||||||||||||||||||||||||||||||||||||
| ||||||||||||||||||||||||||||||||||||||||||||||||||||||||||||||||||||||||||||||||||||||||||||||||||||||||||||||||||||||||||||||||||||||||||||||||
|
| ||||||||||||||||||||||||||||||||||||||||||||||||||||||||||||||||||||||||||||||||||||||||||||||||||||||||||||||||||||||||||||||||||||||||||||||||
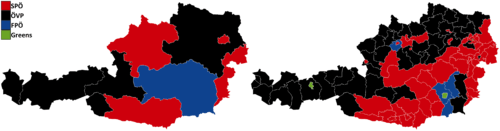
| Largest party by state (left) and district (right) | ||||||||||||||||||||||||||||||||||||||||||||||||||||||||||||||||||||||||||||||||||||||||||||||||||||||||||||||||||||||||||||||||||||||||||||||||
| ||||||||||||||||||||||||||||||||||||||||||||||||||||||||||||||||||||||||||||||||||||||||||||||||||||||||||||||||||||||||||||||||||||||||||||||||
.jpg)


Legislative elections were held in Austria on 29 September 2013.[2]
All 183 seats in the National Council will be filled, with MPs elected by party-list proportional representation. For this election, the Social Democratic Party (SPÖ) and Austrian People's Party (ÖVP) had proposed a reduction in the number of MPs from 183 to 165 as part of austerity measures, but despite overwhelming support from the Austrian populace,[3] the proposals failed to pass in parliament.[4]
Overview
The government is a grand coalition between Austria's two largest parties, the SPÖ and ÖVP, who rule with the SPÖ's Werner Faymann as Chancellor. Support for both governing parties has fallen marginally since the 2008 election. The Freedom Party (FPÖ) and Alliance for the Future of Austria (BZÖ) made significant gains in the previous election, but while the FPÖ gained support after the 2008 election, the BZÖ shrank after the death of its founder Jörg Haider and taking a turn toward liberalism. Additionally, nine of the BZÖ's 21 elected members to the National Council changed their party affiliation during the term: five members joined the Team Stronach, while four joined the FPÖ. Team Stronach, funded by Austrian-Canadian businessman Frank Stronach, has emerged as an anti-euro alternative and eventually started to hurt the FPÖ's standing in the polls. The Greens have solidified their position as the fourth-largest party in opinion polls.
Qualified parties and lists
Parties and lists represented in the National Council
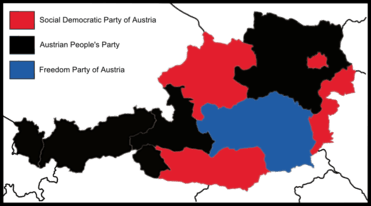
- Social Democratic Party of Austria
- Austrian People's Party
- Freedom Party of Austria
- Alliance for the Future of Austria
- The Greens – The Green Alternative
- Team Stronach
Parties and lists that contested the election in all states[5]
- NEOS – The New Austria (NEOS - Das Neue Österreich)
- Communist Party of Austria
- Pirate Party of Austria
Other parties and lists that contested the election only in the following states
- Christian Party of Austria - in Upper Austria, Styria, Vorarlberg and Burgenland
- The Change (Der Wandel) - in Vienna and Upper Austria
- Socialist Left Party - in Vienna
- EU Exit Party (EU-Austrittspartei) - in Vorarlberg
- Men's Party of Austria (Männerpartei Österreichs) - in Vorarlberg
Ballot qualification for parties and lists
In order to contest the election federally, a party/list needs to collect 2.600 valid signatures from eligible voters ahead of the election.
Parties can also contest the election in individual states only. For this, they have to collect the following numbers of signatures:
- 100 - Burgenland, Vorarlberg
- 200 - Carinthia, Salzburg, Tyrol
- 400 - Upper Austria, Styria
- 500 - Lower Austria, Vienna
Parties can collect the signatures between July 9 and August 2. The state and federal election commissions will validate the signatures and announce the qualified parties on August 8.
Campaign
Issues included corruption scandals across the main parties and Austria's relative financial stability facing a probable crisis.[6]
Opinion polling
Recent opinion polls
| Agency/Source | Date | SPÖ | ÖVP | FPÖ | Greens | Stronach | BZÖ | NEOS | Pirates | KPÖ | Others |
|---|---|---|---|---|---|---|---|---|---|---|---|
| Gallup/Neos.eu | 2013-09-23 | 27% | 23% | 21% | 14% | 6% | 3% | 4% | 1% | 1% | - |
| OGM/Kurier | 2013-09-21 | 27% | 22% | 21% | 14% | 6% | 4% | 4% | 1% | 1% | - |
| Market/Der Standard | 2013-09-20 | 26% | 23% | 19% | 15% | 7% | 4% | 3% | 1% | 1% | 1% |
| Gallup/Österreich | 2013-09-20 | 27% | 23% | 20% | 14% | 7% | 2.5% | 3.5% | 1% | 1% | 1% |
| Karmasin/Heute | 2013-09-20 | 27% | 23% | 21% | 14% | 7% | 2% | 3% | 1.5% | 1.5% | - |
| Hajek/ATV | 2013-09-19 | 27% | 23% | 20% | 15% | 7% | 3% | 3% | 1% | 1% | 1% |
| Meinunungsraum/Neos.eu | 2013-09-19 | 28% | 24% | 19% | 15% | 7% | 2% | 4% | - | - | 1% |
| Market/Standard | 2013-09-15 | 26% | 22% | 20% | 15% | 9% | 3% | 2% | 1% | 1% | 1% |
| Spectra/Oberösterreichische Nachrichten | 2013-09-14 | 26% | 23% | 20% | 13% | 9% | 4% | 1.5% | - | - | 3.5% |
| Karmasin/Profil | 2013-09-14 | 28% | 25% | 20% | 15% | 6% | 2% | 3% | - | - | 1% |
| Gallup/Österreich | 2013-09-13 | 28% | 25% | 20% | 15% | 7% | 1% | 3% | 1% | - | - |
| Gallup/Österreich | 2013-09-06 | 28% | 24% | 19% | 15% | 8% | 2% | 2% | 1% | 1% | - |
| OGM/Kurier | 2013-08-31 | 27% | 24% | 20% | 15% | 7% | 3% | 2% | 1% | - | 1% |
| Karmasin/Profil | 2013-08-31 | 28% | 24% | 20% | 15% | 7% | 2% | 1% | - | - | 3% |
| Market/Standard | 2013-08-30 | 26% | 22% | 19% | 16% | 9% | 3% | 2% | 1% | 1% | 1% |
| Gallup/Österreich | 2013-08-30 | 28% | 23% | 19% | 15% | 9% | 2% | 2% | 1% | 1% | - |
| Meinungsraum/NEWS | 2013-08-29 | 27% | 24% | 19% | 14% | 8% | 2% | 3% | 2% | - | 1% |
| Spectra/Vorarlberger Nachrichten | 2013-08-24 | 27% | 25% | 19% | 14% | 7% | 3% | - | - | - | 5% |
| Gallup/Österreich | 2013-08-23 | 28% | 24% | 18% | 15% | 9% | 2% | 2% | 1% | 1% | - |
| Karmasin/Heute | 2013-08-23 | 28% | 25% | 20% | 15% | 7% | 1% | 2% | 1% | 1% | - |
| Market/Standard | 2013-08-15 | 26% | 24% | 18% | 15% | 9% | 3% | 2% | 1% | 1% | 1% |
| IMAS/Kronen Zeitung | 2013-08-10 | 27% | 25% | 20% | 13% | 9% | 3% | - | - | - | 3% |
| Karmasin/Profil | 2013-08-10 | 28% | 25% | 18% | 16% | 7% | 3% | - | - | - | 3% |
| Gallup/Österreich | 2013-08-09 | 28% | 25% | 17% | 16% | 8% | 2% | 2% | 1% | 1% | - |
| Meinungsraum/Neos.eu | 2013-08-08 | 26% | 24% | 20% | 13% | 9% | 2% | 3% | 2% | 1% | - |
Older opinion polls
| Agency/Source | Date | SPÖ | ÖVP | FPÖ | BZÖ | Greens | KPÖ | Pirates | Stronach | Others | |
|---|---|---|---|---|---|---|---|---|---|---|---|
| Karmasin/Profil | 2012-03-10 | 29% | 24% | 26% | 3% | 13% | - | - | - | 5% | |
| Gallup/Ö24 | 2012-03-11 | 29% | 25% | 27% | 3% | 13% | - | - | - | 3% | |
| Gallup/Ö24 | 2012-03-24 | 28% | 23% | 28% | 3% | 14% | - | - | - | 4% | |
| Karmasin/Profil | 2012-04-05 | 29% | 23% | 27% | 2% | 13% | - | - | - | 6% | |
| Gallup/Ö24 | 2012-04-22 | 27% | 22% | 28% | 3% | 14% | - | 6% | - | - | |
| Karmasin/Heute | 2012-04-23 | 27% | 23% | 27% | 3% | 13% | - | - | - | 7% | |
| Gallup/Ö24 | 2012-05-12 | 26% | 21% | 27% | 3% | 13% | - | 7% | - | 3% | |
| Market/Standard | 2012-05-19 | 29% | 22% | 27% | 5% | 14% | - | - | - | 3% | |
| Gallup/Ö24 | 2012-05-26 | 27% | 22% | 26% | 3% | 14% | - | 5% | - | 3% | |
| Karmasin/Profil | 2012-06-02 | 30% | 25% | 24% | 3% | 12% | - | - | - | 6% | |
| Gallup/Ö24 | 2012-06-09 | 28% | 23% | 24% | 3% | 14% | - | 6% | - | 2% | |
| Gallup/Ö24 | 2012-06-16 | 28% | 24% | 23% | 2% | 12% | - | 7% | - | 4% | |
| OGM/Kurier | 2012-06-16 | 29% | 25% | 25% | 3% | 14% | - | - | - | 4% | |
| Market/Standard | 2012-06-24 | 28% | 23% | 27% | 5% | 14% | - | - | - | 3% | |
| Peter Hajek/ATV | 2012-06-29 | 30% | 25% | 25% | 5% | 12% | - | - | - | 3% | |
| Karmasin/Profil | 2012-06-30 | 29% | 23% | 24% | 4% | 13% | - | - | - | 7% | |
| Gallup/Ö24 | 2012-06-30 | 28% | 23% | 24% | 3% | 12% | - | 7% | - | 3% | |
| Gallup/Ö24 | 2012-07-08 | 28% | 22% | 23% | 3% | 12% | - | 5% | 4% | 3% | |
| Gallup/Ö24 | 2012-07-21 | 28% | 21% | 23% | 2% | 12% | - | 5% | 6% | 3% | |
| Gallup/Ö24 | 2012-08-04 | 29% | 21% | 21% | 2% | 12% | - | 6% | 6% | 3% | |
| Gallup/Ö24 | 2012-08-18 | 28% | 21% | 20% | 3% | 14% | - | 4% | 8% | 2% | |
| Market/Standard | 2012-08-19 | 30% | 23% | 21% | 4% | 16% | - | - | - | 6% | |
| Karmasin/Profil | 2012-08-25 | 29% | 23% | 21% | 2% | 14% | - | - | 7% | 4% | |
| Gallup/Ö24 | 2012-08-26 | 29% | 22% | 20% | 2% | 14% | - | 3% | 9% | 1% | |
| Market/Standard | 2012-08-31 | 30% | 24% | 21% | 3% | 15% | - | - | - | 7% | |
| Gallup/Ö24 | 2012-09-01 | 28% | 21% | 20% | 3% | 14% | - | 2% | 10% | 2% | |
| Gallup/Ö24 | 2012-09-10 | 28% | 23% | 20% | 2% | 13% | - | 2% | 10% | 2% | |
| OGM/Kurier | 2012-09-16 | 28% | 23% | 23% | 3% | 12% | - | - | 6% | 5% | |
| Market/Standard | 2012-09-20 | 29% | 23% | 21% | 4% | 16% | - | - | 6% | 5% | |
| Gallup/Ö24 | 2012-09-23 | 27% | 23% | 21% | 2% | 14% | - | 3% | 9% | 1% | |
| meinungsraum.at | 2012-09-26 | 27% | 19% | 21% | 3% | 15% | - | 3% | 9% | 3% | |
| Gallup/Ö24 | 2012-09-28 | 26% | 23% | 20% | 2% | 14% | - | 2% | 12% | - | |
| Gallup/Ö24 | 2012-10-06 | 26% | 22% | 21% | 2% | 14% | - | 2% | 12% | - | |
| Market/Standard | 2012-10-10 | 28% | 22% | 20% | 2% | 16% | - | - | 10% | 2% | |
| Karmasin/Profil | 2012-10-19 | 25% | 23% | 22% | 2% | 15% | - | - | 10% | - | |
| Gallup/Ö24 | 2012-10-21 | 25% | 22% | 22% | 2% | 15% | - | 2% | 11% | - | |
| Gallup/Ö24 | 2012-10-27 | 25% | 22% | 22% | 2% | 15% | - | - | 11% | - | |
| Market/Standard | 2012-10-28 | 27% | 23% | 22% | 1% | 15% | - | - | 10% | - | |
| Gallup/Ö24 | 2012-11-11 | 26% | 23% | 21% | 2% | 14% | - | 2% | 11% | - | |
| Karmasin/Profil | 2012-11-17 | 27% | 24% | 21% | 2% | 13% | - | - | 10% | - | |
| Gallup/Ö24 | 2012-11-24 | 27% | 22% | 21% | 1% | 15% | - | 2% | 10% | - | |
| Karmasin/Profil | 2012-11-30 | 27% | 22% | 22% | - | 14% | 1% | - | 8% | 3% | |
| Gallup/Ö24 | 2012-12-01 | 27% | 23% | 19% | 1% | 13% | 4% | 1% | 11% | 2% | |
| Karmasin/Profil | 2012-12-18 | 28% | 24% | 21% | 1% | 13% | - | - | 2% | ||
| Gallup/Ö24 | 2012-12-19 | 27% | 23% | 20% | 1% | 14% | - | 1% | 11% | 3% | |
| Gallup/Ö24 | 2012-12-30 | 27% | 23% | 21% | 1% | 14% | - | 1% | 10% | 3% | |
| Market/Standard | 2013-01-02 | 27% | 24% | 23% | 2% | 14% | 1% | 1% | 7% | 1% | |
| Gallup/Ö24 | 2013-01-13 | 28% | 23% | 20% | 1% | 14% | 2% | 1% | 10% | 1% | |
| Gallup/Ö24 | 2013-01-26 | 27% | 25% | 21% | 1% | 13% | 2% | 1% | 9% | 1% | |
| Gallup/Ö24 | 2013-02-09 | 27% | 25% | 21% | 1% | 14% | 2% | 1% | 8% | 1% | |
| Gallup/Ö24 | 2013-02-19 | 28% | 25% | 21% | 1% | 14% | 1% | 1% | 8% | 2% | |
| Karmasin/Heute | 2013-02-22 | 27% | 24% | 23% | 3% | 12% | 1% | - | 10% | - | |
| Gallup/Ö24 | 2013-02-24 | 27% | 25% | 22% | 2% | 13% | 1% | - | 9% | 1% | |
| Gallup/Ö24 | 2013-03-07 | 28% | 25% | 20% | 2% | 13% | 1% | - | 10% | 1% | |
| Market/Standard | 2013-03-15 | 26% | 24% | 20% | 2% | 14% | 1% | - | 9% | 3% | |
| Market/Standard | 2013-04-01 | 26% | 24% | 19% | 4% | 14% | - | - | 10% | 3% | |
| Karmasin/Heute | 2013-04-05 | 27% | 24% | 19% | 2% | 14% | 2% | 1% | 9% | - | |
| Gallup/Ö24 | 2013-04-07 | 27% | 25% | 19% | 1% | 14% | 1% | 1% | 9% | - | |
| Karmasin/Profil | 2013-04-20 | 28% | 25% | 19% | 1% | 13% | - | - | 10% | - | |
| Gallup/Ö24 | 2013-04-20 | 27% | 24% | 19% | 2% | 13% | 1% | 1% | 10% | - | |
| Karmasin/Heute | 2013-05-03 | 28% | 24% | 19% | 2% | 14% | 1% | 1% | 8% | 3% | |
| Market/Standard | 2013-05-10 | 25% | 24% | 19% | 2% | 16% | - | 2% | 10% | 2% | |
| Karmasin/Profil | 2013-05-16 | 26% | 25% | 18% | 2% | 16% | - | - | 10% | 3% | |
| Gallup/Ö24 | 2013-05-29 | 27% | 25% | 18% | 2% | 15% | 1% | 1% | 9% | 2% | |
| Karmasin/Heute | 2013-06-01 | 27% | 25% | 18% | 1% | 16% | - | - | 10% | 3% | |
| Gallup/Ö24 | 2013-06-14 | 28% | 25% | 18% | 2% | 14% | 1% | 1% | 9% | 2% | |
| Karmasin/Profil | 2013-06-15 | 27% | 24% | 18% | 2% | 15% | - | - | 8% | 6% | |
| Gallup/Ö24 | 2013-07-28 | 27% | 25% | 18% | 15% | 8% | 2% | - | 1% | - | 4% |
| Karmasin/Heute | 2013-07-26 | 27% | 25% | 19% | 14% | 9% | 2% | 2% | 1% | 1% | - |
| IMAS/Krone | 2013-07-21 | 27% | 25% | 19% | 13% | 10% | 2.5% | - | - | - | 3.5% |
| Spectra/OÖN | 2013-07-20 | 27% | 24% | 18% | 14% | 10% | 2% | - | - | - | 5% |
| Market/Standard | 2013-07-19 | 25% | 24% | 19% | 15% | 9% | 3% | - | - | - | 5% |
| Gallup/Ö24 | 2013-07-13 | 27% | 24% | 18% | 15% | 8% | 2% | - | 2% | - | 3% |
| Karmasin/Profil | 2013-07-13 | 28% | 25% | 18% | 15% | 7% | 3% | - | - | - | 4% |
| Market/Standard | 2013-07-07 | 26% | 24% | 19% | 16% | 8% | 2% | - | 2% | 1% | 2% |
| OGM/Kurier | 2013-07-07 | 27% | 24% | 19% | 15% | 8% | 3% | - | - | - | 4% |
Results
| Parties | Votes | +/− | % | +/− | Seats | +/− | |
|---|---|---|---|---|---|---|---|
| Social Democratic Party of Austria (Sozialdemokratische Partei Österreichs) | 1,258,605 | −171,601 | 26.82 | −2.44 | 52 | −5 | |
| Austrian People's Party (Österreichische Volkspartei) | 1,125,876 | −143,780 | 23.99 | −1.99 | 47 | −4 | |
| Freedom Party of Austria (Freiheitliche Partei Österreichs) | 962,313 | +105,284 | 20.51 | +2.97 | 40 | +6 | |
| The Greens – The Green Alternative (Die Grünen – Die Grüne Alternative) | 582,657 | +72,721 | 12.42 | +1.99 | 24 | +4 | |
| Team Stronach (Team Stronach für Österreich) | 268,679 | New | 5.73 | New | 11 | New | |
| NEOS – The New Austria (NEOS – Das Neue Österreich) | 232,946 | New* | 4.96 | New* | 9 | New* | |
| Alliance for the Future of Austria (Bündnis Zukunft Österreich) | 165,746 | -357,187 | 3.53 | –7.17 | 0 | –21 | |
| Communist Party of Austria (Kommunistische Partei Österreichs) | 48,175 | +10,813 | 1.03 | +0.27 | 0 | — | |
| Pirate Party of Austria (Piratenpartei Österreichs) | 36,265 | New | 0.77 | New | 0 | New | |
| Christian Party of Austria (Christliche Partei Österreichs) | 6,647 | –24,433 | 0.14 | –0.50 | 0 | — | |
| Others | 4,998 | — | 0.11 | — | 0 | — | |
| Invalid/blank votes | 89,503 | –14,140 | — | — | — | — | |
| Total | 4,782,410 | –208,542 | 100.0 | — | 183 | — | |
| Registered voters/turnout | 6,384,308 | 74.91 | –3.90 | — | — | ||
| Source: Austrian Interior Ministry | |||||||
Results by state
| State results in % | SPÖ | ÖVP | FPÖ | Greens | TS | NEOS | BZÖ | KPÖ | others |
|---|---|---|---|---|---|---|---|---|---|
| | 37.3 | 26.8 | 17.4 | 6.8 | 5.9 | 2.8 | 2.0 | 0.5 | 0.7 |
| | 32.4 | 15.2 | 17.9 | 11.8 | 6.9 | 3.7 | 10.8 | 0.6 | 0.7 |
| | 27.6 | 30.6 | 18.8 | 9.6 | 4.7 | 4.5 | 2.7 | 0.8 | 0.7 |
| | 27.2 | 25.4 | 21.4 | 12.2 | 4.8 | 3.4 | 3.5 | 0.7 | 1.4 |
| | 23.0 | 26.7 | 21.2 | 14.8 | 5.2 | 4.6 | 3.2 | 0.6 | 0.7 |
| | 23.8 | 20.9 | 24.0 | 10.6 | 10.0 | 3.9 | 3.9 | 1.8 | 1.1 |
| | 18.3 | 32.3 | 19.4 | 15.2 | 5.6 | 4.9 | 3.0 | 0.7 | 0.7 |
| | 13.1 | 26.3 | 20.2 | 17.0 | 5.3 | 13.1 | 2.4 | 0.5 | 2.0 |
| | 31.6 | 14.5 | 20.6 | 16.4 | 3.9 | 7.6 | 2.4 | 1.7 | 1.3 |
| | 26.8 | 24.0 | 20.5 | 12.4 | 5.7 | 5.0 | 3.5 | 1.0 | 1.0 |
| Source: Nationalratswahl 2013, Austrian Ministry of the Interior | |||||||||
The losses for the government parties (both the SPÖ and the ÖVP had the worst election result in history) resulted in strong gains for the far right, the election was seen as strong for the far-right and in support of Eurosceptics.
Especially in Carinthia, the Freedom Party (FPÖ) benefited most from the BZÖ's weakness since Jörg Haider's death in autumn 2008: the FPÖ's share of the vote rose from 7.6% to 17.9%, and they became the second strongest party in the state. In contrast, the state's former leading party BZÖ came fifth, with their share falling from 38.5% to 10.8%, while the SPÖ came first in Carinthia with 32.4%.
However, in Styria the FPÖ came first with 24.0%; the SPÖ were second with 23.8%.
In the other states no major changes of the leading party occurred.
Government formation
The "grand coalition" of SPÖ and ÖVP have retained their majority, although other coalitions could still be possible.[7] While the SPÖ are keen to renew the coalition, the ÖVP are also considering the possibility of a coalition with the FPÖ and another smaller party.[8] On October 14, the SPÖ and the ÖVP agreed to start coalition talks with each other.[9] On December 16, the second Faymann cabinet was formed.
See also
References
- ↑ "Nationalratswahl 2013 - Endgültiges Gesamtergebnis". Website of the Austrian Ministry of the Interior (in German). Bundesministerium für Inneres. Retrieved 17 December 2014.
- ↑ Regierung legt sich fest: Wahl am 29. September - Die Presse, 21 February 2013
- ↑ Sparpaket: Prammer sagt Verkleinerung des Nationalrats ab - Der Standard, 19 November 2012
- ↑ Regierungsspitze hofft weiter auf NR-Verkleinerung - Der Standard, 20 November 2012
- ↑ Nationalratswahl 2013 - Abgeschlossene und veröffentlichte Landeswahlvorschläge - bmi.gv.at, 8 August 2013
- ↑ Austrians voting general elections Al Jazeera 29 September 2013
- ↑ Governing coalition slips election Al Jazeera 29 September 2013
- ↑ Austria coalition vote Yahoo!
- ↑ Austria's biggest parties agree coalition talks Reuters, Oct. 14
External links
- Social Democratic Party of Austria
- Austrian People's Party
- Freedom Party of Austria
- The Greens – The Green Alternative
- Alliance for the Future of Austria
- Team Stronach
- Christian Party of Austria
- Communist Party of Austria
- EU Withdrawal Party
- Men's Party of Austria
- NEOS – The New Austria
- Pirate Party of Austria
- Socialist Left Party
- The Change
| |||||||||||||||||||
| |||||||||||||||||||