Biological data visualization
Biology Data Visualization is a branch of bioinformatics concerned with the application of computer graphics, scientific visualization, and information visualization to different areas of the life sciences. This includes visualization of sequences, genomes, alignments, phylogenies, macromolecular structures, systems biology, microscopy, and magnetic resonance imaging data. Software tools used for visualizing biological data range from simple, standalone programs to complex, integrated systems.
State-of-the-art and perspectives
Today we are experiencing a rapid growth in volume and diversity of biological data, presenting an increasing challenge for biologists. A key step in understanding and learning from these data is visualization. Thus, there has been a corresponding increase in the number and diversity of systems for visualizing biological data.
An emerging trend is the blurring of boundaries between the visualization of 3D structures at atomic resolution, visualization of larger complexes by cryo-electron microscopy, and visualization of the location of proteins and complexes within whole cells and tissues.[1][2]
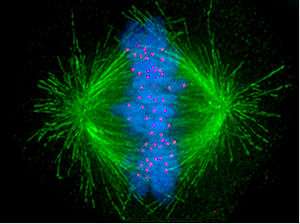
A second emerging trend is an increase in the availability and importance of time-resolved data from systems biology, electron microscopy[3][4] and cell and tissue imaging. In contrast, visualization of trajectories has long been a prominent part of molecular dynamics.
Finally, as datasets are increasing in size, complexity, and interconnectness, biological visualization systems are improving in usability, data integration and standardization.
List of visualization systems
A large number of software systems are available for visualization biological data. The links below link lists of such systems, grouped by application areas.
-
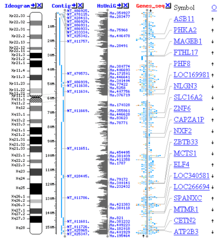
Genomic and assembly data
-

Alignments, phylogeny and evolution


Related conferences
- BioVis: IEEE Symposium on Biological Data Visualization
- Applications of Information Visualization in Bioinformatics
- CIBDV: Computational Intelligence for Biological Data Visualization
- IVBI: Information Visualization in Biomedical Informatics Symposium
- VMLS: Visualization in Medicine & Life Sciences
- VIZBI: Workshop on Visualizing Biological Data
References
- ↑ Lucić (2005). "Structural studies by electron tomography: from cells to molecules". Annual Review of Biochemistry. 74: 833–65. doi:10.1146/annurev.biochem.73.011303.074112. PMID 15952904.
|first2=missing|last2=in Authors list (help);|first3=missing|last3=in Authors list (help) - ↑ Steven (2008). "The future is hybrid". Journal of structural biology. 163 (3): 186–95. doi:10.1016/j.jsb.2008.06.002. PMID 18602011.
|first2=missing|last2=in Authors list (help) - ↑ Plattner (2006). "Sub-second cellular dynamics: time-resolved electron microscopy and functional correlation". International review of cytology. International Review of Cytology. 255: 133–76. doi:10.1016/S0074-7696(06)55003-X. ISBN 9780123735997. PMID 17178466.
|first2=missing|last2=in Authors list (help) - ↑ Frank (2004). "Time-resolved imaging of macromolecular processes and interactions". Journal of structural biology. 147 (3): 209–10. doi:10.1016/j.jsb.2004.06.003. PMID 15450290.
|first2=missing|last2=in Authors list (help)