Bolivian regional elections, 2015
 |
| This article is part of a series on the politics and government of Bolivia |
|
Presidency |
The 2015 Bolivian regional elections were held on 29 March 2015. Departmental and municipal authorities were elected by an electorate of approximately 6 million people. Among the officials elected were:
- Governors of all nine departments
- Members of Departamental Legislative Assemblies in each department; 23 seats in these Assemblies will represent indigenous communities, and have been selected by traditional usos y costumbres in the weeks prior to the election
- Mayors and Council members in all 339 municipalities[1]
- Provincial Subgovernors and Municipal Corregidors (executive authorities) in Beni
- Sectional Development Executives at the provincial level in Tarija
- The nine members of the Regional Assembly in the autonomous region of Gran Chaco[2]
Altogether, 2,642 officials were elected.[3] Almost every elected office, but not Mayor, included a simultaneously elected alternate of the same party.
Political parties participating
Only the Movement towards Socialism was involved in all 339 municipal contests.[4] Other parties participating in large numbers of contests are as follows:
| Party | Number of Municipalities | Mayors elected[5] | Significant Cities Won |
|---|---|---|---|
| Movement towards Socialism | 339 | 225 | Two departmental capitals: Sucre, Potosí. |
| Democrats | 23 | Santa Cruz de la Sierra, Cochabamba, its other 21 municipalities are in Santa Cruz Department. | |
| Movement for Sovereignty | 14 | All in La Paz Department | |
| Revolutionary Nationalist Movement | 11 | 9 in Beni, and 4 in Santa Cruz | |
| Autonomous Nationalities for Change and Empowerment (NACER) | 3 | ||
| National Unity Front (UN) | 2 | El Alto | |
| Pando United and Dignified | 2 | Cobija | |
| UNIR | 2 | Tarija | |
Results
Bolivia's ruling MAS party suffered some defeats and setbacks in the subnational elections compared to its performance in 2010 and its victory in the 2014 presidential election.[6]
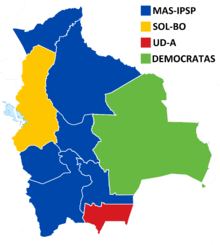
Governors
| Party | Votes | % | Candidates | Elected | |
|---|---|---|---|---|---|
| Movement for Socialism | MAS-IPSP | 1 909 314 | 41,79 % | 9 | 6 |
| Social Democrat Movement | DEMOCRATAS | 940 286 | 20,58 % | 4 | 1 |
| Sovereignty and Freedom | SOL-BO | 673 244 | 14,73 % | 1 | 1 |
| National Unity Front | UN | 182 404 | 3,99 % | 4 | 0 |
| Revolutionary Nationalist Movement | MNR | 108 544 | 2,37 % | 5 | 0 |
| Autonomist Departmental Unity | UD-A | 105 391 | 2,31 % | 1 | 1 |
| Front for Victory | FPV | 101 871 | 2,23 % | 6 | 0 |
| We Are All Chuquisaca | CST | 101 257 | 2,22 % | 1 | 0 |
| United for Cochabamba | UNICO | 76 907 | 1,68 % | 1 | 0 |
| Movement for Sovereignty | MPS | 63 941 | 1,40 % | 1 | 0 |
| People's Originary Movement of Potosí | POTOSI-MOP | 53 287 | 1,17 % | 1 | 0 |
| Autonomous Nationalities for Change and Empowerment | NACER | 49 214 | 1,08 % | 1 | 0 |
| New Citizen Power | NPC | 47 220 | 1,03 % | 1 | 0 |
| Tarija For All | TPT | 31 310 | 0,68 % | 1 | 0 |
| Popular Participation | PP | 28 700 | 0,63 % | 1 | 0 |
| Solidarity Civic Unity | UCS | 20 042 | 0,44 % | 1 | 0 |
| Patriotic Social Alliance | ASP | 18 513 | 0,41 % | 1 | 0 |
| Strength and Hope | FE | 17 082 | 0,37 % | 1 | 0 |
| Pando United and Dignified | PUD | 13 042 | 0,28 % | 1 | 0 |
| Up with Chuquisaca | ACH | 11 427 | 0,25 % | 1 | 0 |
| Revolutionary Left Front | FRI | 9070 | 0,20 % | 1 | 0 |
| Integrity, Security, and Autonomy | ISA | 5768 | 0,13 % | 1 | 0 |
| Amazon Social Power | PASO | 1142 | 0,02 % | 1 | 0 |
| Valid votes | 4 568 976 | 88,08 % | 32 | 9 | |
| Blank votes | 356 048 | 6,86 % | |||
| Null votes | 261 942 | 5,05 % | |||
| Total ballots cast | 5 186 966 | 100,00 % | |||
| Source: Tribunal Supremo Electoral, Resultados Elecciones Subnacionales 2015 | |||||
The governors of Beni and Tarija were elected in a May 3 runoff election.
References
- ↑ "Bolivia elige hoy 4.975 nuevas autoridades subnacionales". La Razón. 2015-03-29. Retrieved 2015-05-08.
- ↑ Cardozo G., Jesús (2010-03-29). "Los números y datos de las elecciones subnacionales". El País. Tarija, Bolivia. Retrieved 2015-05-08.
- ↑ Órgano Electoral Plurinacional (2016). Informe de labores, rendición de cuentas: Gestión 2015 y desafios para la gestión 2016.
- ↑ "Elecciones en Bolivia," Bolivia Prensa, 3 April 2010.
- ↑ "MAS gana en 225 de los 339 municipios del país". El Deber. Santa Cruz, Bolivia. 2016-04-05. Retrieved 2016-03-13.
- ↑ "A Vote for Local Democracy in Bolivia's Regional Elections". NACLA. Retrieved 12 July 2015.
| Presidential elections | |
|---|---|
| Parliamentary elections | |
| Judicial elections | |
| Local elections | |
| Referendums | |