Brigadier Mayor César Raúl Ojeda Airport
| Brigadier Mayor Cesar Raúl Ojeda Airport Aeropuerto de San Luis - Brigadier Mayor César Raúl Ojeda | |||||||||||
|---|---|---|---|---|---|---|---|---|---|---|---|
| IATA: LUQ – ICAO: SAOU | |||||||||||
| Summary | |||||||||||
| Airport type | Public / Militar | ||||||||||
| Operator | Government and Aeropuertos Argentina 2000 | ||||||||||
| Serves | San Luis | ||||||||||
| Location | Av. Fueza Aérea 3095. (D5700BZG) SAN LUIS | ||||||||||
| Elevation AMSL | 2,328 ft / 710 m | ||||||||||
| Coordinates | 33°16′30″S 66°21′04″W / 33.27500°S 66.35111°WCoordinates: 33°16′30″S 66°21′04″W / 33.27500°S 66.35111°W | ||||||||||
| Map | |||||||||||
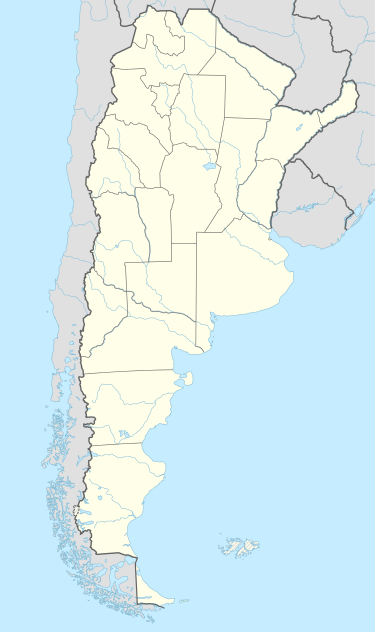 LUQ Location of airport in Argentina | |||||||||||
| Runways | |||||||||||
| |||||||||||
| Statistics (2010) | |||||||||||
| |||||||||||
Brigadier Mayor César Raúl Ojeda Airport (Spanish: Aeropuerto de San Luis - Brigadier Mayor César Raúl Ojeda) (IATA: LUQ, ICAO: SAOU) is an airport in San Luis Province, Argentina serving the city of San Luis. It is served by Aerolíneas Argentinas.
In 2007 (March, April and May), the airport was closed because of repaving the main runway. In 2007 it served to 31,509 passengers. It has a daily flight to Buenos Aires vía San Rafael
It consists of 88,500 m² of runways, 55,100m² of taxiways, a 1,000m² terminal, a 960m² hangar and pariking place for 46 cars. It is operated by Aeropuertos Argentina 2000.
Airlines and destinations
| Airlines | Destinations |
|---|---|
| Aerolíneas Argentinas operated by Austral Líneas Aéreas | Buenos Aires-Aeroparque |
Statistics
| Passengers | Change from previous year | Aircraft operations | Change from previous year | Cargo (metric tons) | Change from previous year | |
|---|---|---|---|---|---|---|
| 2005 | 48,726 | | 1,426 | | 230 | |
| 2006 | 44,788 | | 1,329 | | 111 | |
| 2007 | 31,509 | | 1,086 | | 66 | |
| 2008 | 27,452 | | 1,366 | | 92 | |
| 2009 | 36,990 | | 1,605 | | 20 | |
| 2010 | 38,280 | | 1,876 | | 41 | |
| Source: Airports Council International. World Airport Traffic Statistics (Years 2005-2010) | ||||||
References
- ↑ Airport Council International 2010 World Airport Traffic Report
External links
This article is issued from Wikipedia - version of the 11/25/2016. The text is available under the Creative Commons Attribution/Share Alike but additional terms may apply for the media files.