Caernarfon (National Assembly for Wales constituency)
Coordinates: 52°58′34″N 4°18′29″W / 52.976°N 4.308°W
| Former Welsh Assembly county constituency | |
|---|---|
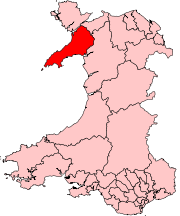 | |
| Caernarfon shown as one of the 40 Welsh Assembly constituencies from 1999 to 2007 | |
| Created: | 1999 |
| Abolished: | 2007 |
| Electoral region: | North Wales |
| Preserved county: | Gwynedd |
Caernarfon was a constituency of the National Assembly for Wales from 1999 to 2007. It elected one Assembly Member by the first past the post method of election. Also, however, it was one of nine constituencies in the North Wales electoral region, which elected four additional members, in addition to nine constituency members, to produce a degree of proportional representation for the region as a whole.
Boundaries
The constituency was created for the first election to the Assembly, in 1999, with the name and boundaries of the Caernarfon Westminster constituency. It was entirely within the preserved county of Gwynedd.
The other eight constituencies of the region were Alyn and Deeside, Clwyd West, Clwyd South, Conwy, Delyn, Vale of Clwyd, Wrexham and Ynys Môn.
The constituency was abolished at the 2007 election. Part of the constituency then joined the new Arfon constituency, and part the new Dwyfor Meirionnydd constituency, both constituencies entirely within the preserved county of Gwynedd. The Arfon constituency is within the North Wales electoral region. The Dwyfor Meirionnydd constituency is within the Mid and West Wales electoral region.
Assembly Members
| Period | Member | Party | |
|---|---|---|---|
| 1999 | Dafydd Wigley | Plaid Cymru | |
| 2003 | Alun Ffred Jones | Plaid Cymru | |
| 2007 | constituency abolished | ||
Elections
| Party | Candidate | Votes | % | ± | |
|---|---|---|---|---|---|
| Plaid Cymru | Alun Ffred Jones | 11,675 | 55.0 | −10.9 | |
| Labour | Martin R. Eaglestone | 5,770 | 27.2 | +4.4 | |
| Conservative | Goronwy O. Edwards | 2,402 | 11.3 | +2.7 | |
| Liberal Democrats | Steven William Churchman | 1,392 | 6.6 | +3.8 | |
| Majority | 5,905 | 27.8 | −15.3 | ||
| Turnout | 21,239 | 45.0 | −15.7 | ||
| Plaid Cymru hold | Swing | −7.7 | |||
| Party | Candidate | Votes | % | ± | |
|---|---|---|---|---|---|
| Plaid Cymru | Dafydd Wigley | 18,748 | 65.8 | N/A | |
| Labour | Tom Jones | 6,475 | 22.7 | N/A | |
| Conservative | Mrs. Bronwen Naish | 2,464 | 8.7 | N/A | |
| Liberal Democrats | David P. Shankland | 791 | 2.8 | N/A | |
| Majority | 12,273 | 43.1 | N/A | ||
| Turnout | 28,748 | 60.5 | N/A | ||
| Plaid Cymru win (new seat) | |||||
See also
- North Wales (National Assembly for Wales electoral region)
- National Assembly for Wales constituencies and electoral regions