Voter turnout
Voter turnout is the percentage of eligible voters who cast a ballot in an election. (Who is eligible varies by country, and should not be confused with the total adult population. For example, some countries discriminate based on sex, race, and/or religion. Age and citizenship are usually among the criteria.) After increasing for many decades, there has been a trend of decreasing voter turnout in most established democracies since the 1980s.[1] In general, low turnout may be due to disenchantment, indifference, or contentment. Low turnout is often considered to be undesirable, and there is much debate over the factors that affect turnout and how to increase it. In spite of significant study into the issue, scholars are divided on reasons for the decline. Its cause has been attributed to a wide array of economic, demographic, cultural, technological, and institutional factors. There have been many efforts to increase turnout and encourage voting.
Different countries have very different voter turnouts. For example, turnout in the United States 2012 presidential election was 55%. In Belgium, which has compulsory voting, and Malta, which does not, participation reaches 95%. These differences are caused by a mix of cultural and institutional factors.
Reasons for voting
The chance of any one vote determining the outcome is low. Some studies show that a single vote in a voting scheme such as the Electoral College in the United States has an even lower chance of determining the outcome.[2] Other studies claim that the Electoral College actually increases voting power.[3] Studies using game theory, which takes into account the ability of voters to interact, have also found that the expected turnout for any large election should be zero.[4]
The basic formula for determining whether someone will vote, on the questionable assumption that people act completely rationally, is[5]

where
- P is the probability that an individual's vote will affect the outcome of an election,
- B is the perceived benefit that would be received if that person's favored political party or candidate were elected,
- D originally stood for democracy or civic duty, but today represents any social or personal gratification an individual gets from voting, and
- C is the time, effort, and financial cost involved in voting.
Since P is virtually zero in most elections, PB is also near zero, and D is thus the most important element in motivating people to vote. For a person to vote, these factors must outweigh C. Experimental political science has found that even when P is likely greater than zero, this term has no effect on voter turnout. Enos and Fowler (2014) conducted a field experiment that exploits the rare opportunity of a tied election for major political office. Informing citizens that the special election to break the tie will be close (meaning a high P term) has little mobilizing effect on voter turnout.[6]
Riker and Ordeshook developed the modern understanding of D. They listed five major forms of gratification that people receive for voting: complying with the social obligation to vote; affirming one's allegiance to the political system; affirming a partisan preference (also known as expressive voting, or voting for a candidate to express support, not to achieve any outcome); affirming one's importance to the political system; and, for those who find politics interesting and entertaining, researching and making a decision.[7] Other political scientists have since added other motivators and questioned some of Riker and Ordeshook's assumptions. All of these concepts are inherently imprecise, making it difficult to discover exactly why people choose to vote.
Recently, several scholars have considered the possibility that B includes not only a personal interest in the outcome, but also a concern for the welfare of others in the society (or at least other members of one's favorite group or party).[8][9] In particular, experiments in which subject altruism was measured using a dictator game showed that concern for the well-being of others is a major factor in predicting turnout[10] and political participation.[11][12] Note that this motivation is distinct from D, because voters must think others benefit from the outcome of the election, not their act of voting in and of itself.
Reasons for not voting
There are philosophical, moral, and practical reasons that some people cite for not voting in electoral politics. Robert LeFevre, Francis Tandy, John Pugsley, Frank Chodorov, George H. Smith, Carl Watner, Wendy McElroy, and Lysander Spooner are some moderately well-known authors who have written about these reasons.[13]
Significance
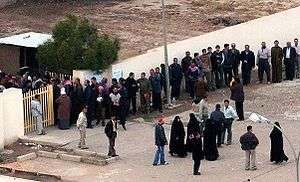
High voter turnout is often considered to be desirable, though among political scientists and economists specializing in public choice, the issue is still debated.[14] A high turnout is generally seen as evidence of the legitimacy of the current system. Dictators have often fabricated high turnouts in showcase elections for this purpose. For instance, Saddam Hussein's 2002 plebscite was claimed to have had 100% participation.[15] Opposition parties sometimes boycott votes they feel are unfair or illegitimate, or if the election is for a government that is considered illegitimate. For example, the Holy See instructed Italian Catholics to boycott national elections for several decades after the creation of the state of Italy.[16] In some countries, there are threats of violence against those who vote, such as during the 2005 Iraq elections, an example of voter suppression. However, some political scientists question the view that high turnout is an implicit endorsement of the system. Mark N. Franklin contends that in European Union elections opponents of the federation, and of its legitimacy, are just as likely to vote as proponents.[17]
Assuming that low turnout is a reflection of disenchantment or indifference, a poll with very low turnout may not be an accurate reflection of the will of the people. On the other hand, if low turnout is a reflection of contentment of voters about likely winners or parties, then low turnout is as legitimate as high turnout, as long as the right to vote exists. Still, low turnouts can lead to unequal representation among various parts of the population. In developed countries, non-voters tend to be concentrated in particular demographic and socioeconomic groups, especially the young and the poor. However, in India, which boasts an electorate of more than 814 million people, the opposite is true. The poor, who comprise the majority of the demographic, are more likely to vote than the rich and the middle classes, and turnout is higher in rural areas than urban areas.[18] In low-turnout countries, these groups are often significantly under-represented in elections. This has the potential to skew policy. For instance, a high voter turnout among the elderly coupled with a low turnout among the young may lead to more money for retirees' health care, and less for youth employment schemes. Some nations thus have rules that render an election invalid if too few people vote, such as Serbia, where three successive presidential elections were rendered invalid in 2003.
Socio-economic factors
| USA (1988) | India (1988) |
|---|---|
| Turnout | |
| 50.1 %[20] | 62 % |
| Income (Quinitile) | |
| Lowest 20%: 36.4% | 57 % |
| 52 | 65 |
| 59 | 73 |
| 67 | 60 |
| Highest 20%: 63.1 | 47 |
| Education | |
| No high school 38% | Illiterate 57% |
| Some high school 43 | Up to middle 83 |
| High school graduate 57 | College 57 |
| Some college 66 | Post-graduate 41 |
| College grad 79 | |
| Post-graduate 84 | |
| Community (1996) | |
| White 56 | Hindu 60 |
| Black 50 | Hindu (OBC) 58 |
| Latino 27 | SC 75 |
| ST 59 | |
| Muslim 70 | |
| Sikh 89 | |
In each country, some parts of society are more likely to vote than others. In high-turnout countries, these differences tend to be limited. As turnout approaches 90%, it becomes difficult to find significant differences between voters and nonvoters, but in low turnout nations the differences between voters and non-voters can be quite marked.[17] These differences appear to persist over time; in fact, the strongest predictor of individual turnout is whether or not one voted in the previous election.[21] As a result, many scholars think of turnout as habitual behavior that can be learned or unlearned, especially among young adults.[22]
Socioeconomic factors significantly affect whether or not individuals develop the habit of voting. The most important socioeconomic factor affecting voter turnout is education. The more educated a person is, the more likely he or she is to vote, even controlling for other factors that are closely associated with education level, such as income and class. Income has some effect independently: wealthier people are more likely to vote, regardless of their educational background. There is some debate over the effects of ethnicity, race, and gender. In the past, these factors unquestionably influenced turnout in many nations, but nowadays the consensus among political scientists is that these factors have little effect in Western democracies when education and income differences are taken into account.[23] However, since different ethnic groups typically have different levels of education and income, there are important differences in turnout between such groups in many societies. Other demographic factors have an important influence: young people are far less likely to vote than the elderly. Occupation has little effect on turnout, with the notable exception of higher voting rates among government employees in many countries.[23]
There can also be regional differences in voter turnout. One issue that arises in continent-spanning nations, such as Australia, Canada, the United States and Russia, is that of time zones. Canada banned the broadcasting of election results in any region where the polls have not yet closed; this ban was upheld by the Supreme Court of Canada. In several recent Australian national elections, the citizens of Western Australia knew which party would form the new government up to an hour before the polling booths in their State closed.
Hereditary factors
While socioeconomic factors undoubtedly play a role in determining voter turnout, new evidence suggests that genetic factors may also be important. Scholars recently used twin studies of validated turnout in Los Angeles and self-reported turnout in the National Longitudinal Study of Adolescent Health to establish that the decision to vote in the United States has very strong heritability.[24] If so, it could help to explain why parental turnout is such a strong predictor of voting in young people,[25] as people inherit genes as well as behaviors from their parents. It might also help to explain why voting appears to be habitual.[26] If there is an innate predisposition to vote or abstain, this would explain why past voting behavior is such a good predictor of future voter reaction.
In addition to the twin study method, scholars have used gene association studies to analyze voter turnout. Two genes that influence social behavior have been directly associated with voter turnout, specifically those regulating the serotonin system in the brain via the production of monoamine oxidase and 5HTT.[27] This study was recently reanalyzed and the findings suggested to be the result of several significant errors. Once these errors were corrected, there was no longer any statistically significant association between common variants of these two genes and voter turnout.[28]
Differences between elections
Within countries there can be important differences in turnout between individual elections .[29] Elections where control of the national executive is not at stake generally have much lower turnouts—often half that for general elections. Municipal and provincial elections, and by-elections to fill casual vacancies, typically have lower turnouts, as do elections for the parliament of the supranational European Union, which is separate from the executive branch of the EU's government. In the United States, midterm congressional elections attract far lower turnouts than Congressional elections held concurrently with Presidential ones.[30] Runoff elections also tend to attract lower turnouts.
In theory, one of the factors that is most likely to increase turnout is a close race. With an intensely polarized electorate and all polls showing a close finish between President George W. Bush and Democratic challenger John F. Kerry, the turnout in the 2004 U.S. presidential election was close to 60%, resulting in a record number of popular votes for both candidates; despite losing the election, Kerry even surpassed Ronald Reagan's 1984 record in terms of the number of popular votes received. However, this race also demonstrates the influence that contentious social issues can have on voter turnout; for example, the voter turnout rate in 1860 wherein anti-slavery candidate Abraham Lincoln won the election was the second-highest on record (81.2 percent, second only to 1876, with 81.8 percent). Nonetheless, there is evidence to support the argument that predictable election results—where one vote is not seen to be able to make a difference—have resulted in lower turnouts, such as Bill Clinton's 1996 re-election (which featured the lowest voter turnout in the United States since 1924), the United Kingdom general election of 2001, and the 2005 Spanish referendum on the European Constitution; all of these elections produced decisive results on a low turnout.
Research shows that bad weather can reduce turnout.[31][32][33][4][34][35] A 2016 study, however, finds no evidence that weather disruptions reduce turnout.[36] The season and the day of the week (although many nations hold all their elections on the same weekday) can also affect turnout. Weekend and summer elections find more of the population on holiday or uninterested in politics, and have lower turnouts. When nations set fixed election dates, these are usually midweek during the spring or autumn to maximize turnout. Variations in turnout between elections tend to be insignificant. It is extremely rare for factors such as competitiveness, weather, and time of year to cause an increase or decrease in turnout of more than five percentage points, far smaller than the differences between groups within society, and far smaller than turnout differentials between nations.[37]
International differences
| Country | Compulsory | № | Turnout |
|---|---|---|---|
| Y | 19 | 95%[39] | |
| N | 6 | 94% | |
| N | 2 | 93%† | |
| Y | 12 | 91% | |
| N**** | 9 | 90% | |
| Y (for voters below 75) | 7 | 90% | |
| N | 10 | 89% | |
| N | 12 | 88% | |
| N | 14 | 87% | |
| N | 9 | 86% | |
| N | 14 | 86% | |
| Y (not enforced) | 10 | 86% | |
| N* | 7 | 85% | |
| N | 6 | 85% | |
| N | 6 | 85% | |
| Y | 12 | 83% | |
| Y | 9 | 83% | |
| N** | 7 | 83% | |
| N | 8 | 81% | |
| N | 9 | 81% | |
| N | 2 | 81% | |
| N | 2 | 80% | |
| N | 9 | 80% | |
| N | 9 | 79% | |
| N | 10 | 78% | |
| N | 9 | 76% | |
| N | 9 | 76% | |
| N | 11 | 75% | |
| N | 11 | 74% | |
| N | 12 | 74% | |
| N | 6 | 73% | |
| N | 12 | 71% | |
| N | 7 | 71% | |
| N | 2 | 69% | |
| N | 66%[40] | ||
| N | 6 | 66% | |
| N | 6 | 66% | |
| N | 2 | 61% | |
| N | 8 | 54% | |
| N | 6 | 51% | |
| N | 18 | 48%*** | |
| *Compulsory voting until 1998 | |||
| **Excludes pre-1968 elections, when voting was compulsory. | |||
| ***Turnout rates during the period ranged from 55% for general election years, to 40% to off-year elections (those for which the presidency was not on the ballot). | |||
| ****In Italy, voting used to be compulsory but only with "innocuous sanctions" (i.e., not enforced) up to 1992.[41][42] | |||
| Statistics from Mark N. Franklin's "Electoral Participation", found in Controversies in Voting Behavior (2001). Includes only "free" elections. | |||
| †Voting is no longer compulsory in Chile, but the turnout figures reflect a time when not voting was legally punished. | |||
Voter turnout varies considerably between nations. It tends to be lower in the United States, Asia and Latin America than in most of Europe, Canada and Oceania. Western Europe averages a 77% turnout, and South and Central America around 54% since 1945.[43] The differences between nations tend to be greater than those between classes, ethnic groups, or regions within nations. Confusingly, some of the factors that cause internal differences do not seem to apply on a global level. For instance, nations with better-educated populaces do not have higher turnouts. There are two main commonly cited causes of these international differences: culture and institutions. However, there is much debate over the relative impact of the various factors.
Cultural factors
Wealth and literacy have some effect on turnout, but are not reliable measures. Countries such as Angola and Ethiopia have long had high turnouts, but so have the wealthy states of Europe. The United Nations Human Development Index shows some correlation between higher standards of living and higher turnout. The age of a democracy is also an important factor. Elections require considerable involvement by the population, and it takes some time to develop the cultural habit of voting, and the associated understanding of and confidence in the electoral process. This factor may explain the lower turnouts in the newer democracies of Eastern Europe and Latin America. Much of the impetus to vote comes from a sense of civic duty, which takes time and certain social conditions that can take decades to develop:
- trust in government;
- degree of partisanship among the population;
- interest in politics, and
- belief in the efficacy of voting.[44]
Demographics also have an effect. Older people tend to vote more than youths, so societies where the average age is somewhat higher, such as Europe; have higher turnouts than somewhat younger countries such as the United States. Populations that are more mobile and those that have lower marriage rates tend to have lower turnout. In countries that are highly multicultural and multilingual, it can be difficult for national election campaigns to engage all sectors of the population.
The nature of elections also varies between nations. In the United States, negative campaigning and character attacks are more common than elsewhere, potentially suppressing turnouts. The focus placed on get out the vote efforts and mass-marketing can have important effects on turnout. Partisanship is an important impetus to turnout, with the highly partisan more likely to vote. Turnout tends to be higher in nations where political allegiance is closely linked to class, ethnic, linguistic, or religious loyalties.[45] Countries where multiparty systems have developed also tend to have higher turnouts. Nations with a party specifically geared towards the working class will tend to have higher turnouts among that class than in countries where voters have only big tent parties, which try to appeal to all the voters, to choose from.[46]
Institutional factors
Institutional factors have a significant impact on voter turnout. Rules and laws are also generally easier to change than attitudes, so much of the work done on how to improve voter turnout looks at these factors. Making voting compulsory has a direct and dramatic effect on turnout. Simply making it easier for candidates to stand through easier nomination rules is believed to increase voting. Conversely, adding barriers, such as a separate registration process, can suppress turnout. The salience of an election, the effect that a vote will have on policy, and its proportionality, how closely the result reflects the will of the people, are two structural factors that also likely have important effects on turnout.
Voter registration
The modalities of how electoral registration is conducted can also affect turnout. For example, until "rolling registration" was introduced in the United Kingdom, there was no possibility of the electoral register being updated during its currency, or even amending genuine mistakes after a certain cut off date. The register was compiled in October, and would come into force the next February, and would remain valid until the next January. The electoral register would become progressively more out of date during its period of validity, as electors moved or died (also people studying or working away from home often had difficulty voting). This meant that elections taking place later in the year tended to have lower turnouts than those earlier in the year. The introduction of rolling registration where the register is updated monthly has reduced but not entirely eliminated this issue since the process of amending the register is not automatic, and some individuals do not join the electoral register until the annual October compilation process.
Another country with a highly efficient registration process is France. At the age of eighteen, all youth are automatically registered. Only new residents and citizens who have moved are responsible for bearing the costs and inconvenience of updating their registration. Similarly, in Nordic countries, all citizens and residents are included in the official population register, which is simultaneously a tax list, voter registration, and membership in the universal health system. Residents are required by law to report any change of address to register within a short time after moving. This is also the system in Germany (but without the membership in the health system).
The elimination of registration as a separate bureaucratic step can result in higher voter turnout. This is reflected in statistics from the United States Bureau of Census, 1982–1983. States that have same day registration, or no registration requirements, have a higher voter turnout than the national average. At the time of that report, the four states that allowed election day registration were Minnesota, Wisconsin, Maine, and Oregon. Since then, Idaho and Maine have changed to allow same day registration. North Dakota is the only state that requires no registration.[47]
Compulsory voting
One of the strongest factors affecting voter turnout is whether voting is compulsory. In Australia, voter registration and attendance at a polling booth have been mandatory since the 1920s, with the most recent federal election in 2013 having turnout figures of 93.23% for the House of Representatives and 93.88% for the Senate.[48][49] Several other countries have similar laws, generally with somewhat reduced levels of enforcement. If a Bolivian voter fails to participate in an election, the citizen may be denied withdrawal of their salary from the bank for three months.[50]
In Mexico and Brazil, existing sanctions for non-voting are minimal or are rarely enforced. When enforced, compulsion has a dramatic effect on turnout.
In Venezuela and the Netherlands compulsory voting has been rescinded, resulting in substantial decreases in turnout.
In Greece voting is compulsory, however there are practically no sanctions for those who do not vote.
In Belgium and Luxembourg voting is compulsory, too, but not strongly enforced. In Luxembourg only voters below the age of 75 and those who are not physically handicapped or chronically ill have the legal obligation to vote.
Sanctions for non-voting behaviour were foreseen sometimes even in absence of a formal requirement to vote. In Italy the Constitution describes voting as a duty (art. 48), though electoral participation is not obligatory. From 1946 to 1992, thus, the Italian electoral law included light sanctions for non-voters (lists of non-voters were posted at polling stations).[51] Turnout rates have not declined substantially since 1992 in Italy, though, pointing to other factors than compulsory voting to explain high electoral participation.
Salience
Mark N. Franklin argues that salience, the perceived effect that an individual vote will have on how the country is run, has a significant effect on turnout. He presents Switzerland as an example of a nation with low salience. The nation's administration is highly decentralized, so that the federal government has limited powers. The government invariably consists of a coalition of parties, and the power wielded by a party is far more closely linked to its position relative to the coalition than to the number of votes it received. Important decisions are placed before the population in a referendum. Individual votes for the federal legislature are thus unlikely to have a significant effect on the nation, which probably explains the low average turnouts in that country. By contrast Malta, with one of the world's highest voter turnouts, has a single legislature that holds a near monopoly on political power. Malta has a two-party system in which a small swing in votes can completely alter the executive.[52] On the other hand, countries with a two party system can experience low turnout if large numbers of potential voters perceive little real difference between the main parties. Voters' perceptions of fairness also have an important effect on salience. If voters feel that the result of an election is more likely to be determined by fraud and corruption than by the will of the people, fewer people will vote.[53]
Proportionality
Another institutional factor that may have an important effect is proportionality, i.e., how closely the legislature reflects the views of the populace. Under a pure proportional representation system the composition of the legislature is fully proportional to the votes of the populace and a voter can be sure that he will be represented in parliament, even if only from the opposition benches. (However many nations that utilise a form of proportional representation in elections depart from pure proportionality by stipulating that smaller parties are not supported by a certain threshold percentage of votes cast will be excluded from parliament.) By contrast, a voting system based on single seat constituencies (such as the plurality system used in North American, the UK and India) will tend to result in many non-competitive electoral districts, in which the outcome is seen by voters as a foregone conclusion.
Proportional systems tend to produce multiparty coalition governments. This may reduce salience, if voters perceive that they have little influence over which parties are included in the coalition.[54] For instance, after the 2005 German election, the creation of the executive not only expressed the will of the voters of the majority party but also was the result of political deal-making. Although there is no guarantee, this is lessened as the parties usually state with whom they will favour a coalition after the elections.
Political scientists are divided on whether proportional representation increases voter turnout, though in countries with proportional representation voter turnout is higher.[55][56][57] There are other systems that attempt to preserve both salience and proportionality, for example, the Mixed member proportional representation system in New Zealand (in operation since 1996), Germany, and several other countries. However, these tend to be complex electoral systems, and in some cases complexity appears to suppress voter turnout.[58] The dual system in Germany, though, seems to have had no negative impact on voter turnout.
Ease of voting
Ease of voting is a factor in rates of turnout. In the United States and most Latin American nations, voters must go through separate voter registration procedures before they are allowed to vote. This two-step process quite clearly decreases turnout. U.S. states with no, or easier, registration requirements have larger turnouts.[59] Other methods of improving turnout include making voting easier through more available absentee polling and improved access to polls, such as increasing the number of possible voting locations, lowering the average time voters have to spend waiting in line, or requiring companies to give workers some time off on voting day. In some areas, generally those where some polling centres are relatively inaccessible, such as India, elections often take several days. Some countries have considered Internet voting as a possible solution. In other countries, like France, voting is held on the weekend, when most voters are away from work. Therefore, the need for time off from work as a factor in voter turnout is greatly reduced.
Many countries have looked into Internet voting as a possible solution for low voter turnout. Some countries like France and Switzerland use Internet voting. However, it has only been used sparingly by a few states in the US. This is due largely to security concerns. For example, the US Department of Defense looked into making Internet voting secure, but cancelled the effort.[60] The idea would be that voter turnout would increase because people could cast their vote from the comfort of their own homes, although the few experiments with Internet voting have produced mixed results.[61]
Voter fatigue
Voter fatigue can lower turnout. If there are many elections in close succession, voter turnout will decrease as the public tires of participating. In low-turnout Switzerland, the average voter is invited to go to the polls an average of seven times a year; the United States has frequent elections, with two votes per year on average, if one includes all levels of government as well as primaries.[62] Holding multiple elections at the same time can increase turnout; however, presenting voters with massive multipage ballots, as occurs in some parts of the United States, can reduce turnouts.[63]
Measuring turnout
Differing methods of measuring voter turnout can contribute to reported differences between nations. There are difficulties in measuring both the numerator, the number of voters who cast votes, and the denominator, the number of voters eligible to vote.
For the numerator, it is often assumed that the number of voters who went to the polls should equal the number of ballots cast, which in turn should equal the number of votes counted, but this is not the case. Not all voters who arrive at the polls necessarily cast ballots. Some may be turned away because they are ineligible, some may be turned away improperly, and some who sign the voting register may not actually cast ballots. Furthermore, voters who do cast ballots may abstain, deliberately voting for nobody, or they may spoil their votes, either accidentally or as an act of protest.
In the United Kingdom, the Electoral Commission distinguishes between "valid vote turnout", which excludes spoilt ballots, and "ballot box turnout", which does not.
In the United States, it has been common to report turnout as the sum of votes for the top race on the ballot, because not all jurisdictions report the actual number of people who went to the polls nor the number of undervotes or overvotes.[64] Overvote rates of around 0.3 percent are typical of well-run elections, but in Gadsden County Florida, the overvote rate was 11 percent in November 2000.[65]
For the denominator, it is often assumed that the number of eligible voters was well defined, but again, this is not the case. In the United States, for example, there is no accurate registry of exactly who is eligible to vote, since only about 70–75% of people choose to register themselves.[66] Thus, turnout has to be calculated based on population estimates. Some political scientists have argued that these measures do not properly account for the large number of illegal aliens, disenfranchised felons and persons who are considered 'mentally incompetent' in the United States, and that American voter turnout is higher than is normally reported.[67] Professor Michael P. McDonald constructed an estimation of the turnout against the 'voting eligible population' (VEP), instead of the 'voting age population' (VAP). For the American presidential elections of 2004, turnout could then be expressed as 60.32% of VEP, rather than 55.27% of VAP.[68]
In New Zealand, registration is supposed to be universal. This does not eliminate uncertainty in the eligible population because this system has been shown to be unreliable, with a large number of eligible but unregistered citizens, creating inflated turnout figures.[69]
A second problem with turnout measurements lies in the way turnout is computed. One can count the number of voters, or one can count the number of ballots, and in a vote-for-one race, one can sum the number of votes for each candidate. These are not necessarily identical because not all voters who sign in at the polls necessarily cast ballots, although they ought to, and because voters may cast spoiled ballots.
Trends of decreasing

Over the last 40 years, voter turnout has been steadily declining in the established democracies.[1] This trend has been significant in the United States, Western Europe, Japan and Latin America. It has been a matter of concern and controversy among political scientists for several decades. During this same period, other forms of political participation have also declined, such as voluntary participation in political parties and the attendance of observers at town meetings. The decline in voting has also accompanied a general decline in civic participation, such as church attendance, membership in professional, fraternal, and student societies, youth groups, and parent-teacher associations.[70] At the same time, some forms of participation have increased. People have become far more likely to participate in boycotts, demonstrations, and to donate to political campaigns.[71]
Before the late 20th century, suffrage — the right to vote — was so limited in most nations that turnout figures have little relevance to today. One exception was the United States, which had near universal white male suffrage by 1840. The U.S. saw a steady rise in voter turnout during the century, reaching its peak in the years after the Civil War. Turnout declined from the 1890s until the 1930s, then increased again until 1960 before beginning its current long decline.[72] In Europe, voter turnouts steadily increased from the introduction of universal suffrage before peaking in the mid-to-late 1960s, with modest declines since then. These declines have been smaller than those in the United States, and in some European countries turnouts have remained stable and even slightly increased. Globally, voter turnout has decreased by about five percentage points over the last four decades.[73]
Reasons for decline
Many causes have been proposed for this decline; a combination of factors is most likely. When asked why they do not vote, many people report that they have too little free time. However, over the last several decades, studies have consistently shown that the amount of leisure time has not decreased. Potential voters' perception that they are busier is common and might be just as important as a real decrease in leisure time. Geographic mobility has increased over the last few decades. There are often barriers to voting in a district where one is a recent arrival, and a new arrival is likely to know little about the local candidate and local issues. Francis Fukuyama has blamed the welfare state, arguing that the decrease in turnout has come shortly after the government became far more involved in people's lives. He argues in Trust: The Social Virtues and The Creation of Prosperity that the social capital essential to high voter turnouts is easily dissipated by government actions. However, on an international level those states with the most extensive social programs tend to be the ones with the highest turnouts. Richard Sclove argues in Democracy and Technology that technological developments in society such as "automobilization," suburban living, and "an explosive proliferation of home entertainment devices" have contributed to a loss of community, which in turn has weakened participation in civic life.[74]
Trust in government and in politicians has decreased in many nations. However, the first signs of decreasing voter turnout occurred in the early 1960s, which was before the major upheavals of the late 1960s and 1970s. Robert D. Putnam argues that the collapse in civil engagement is due to the introduction of television. In the 1950s and 1960s, television quickly became the main leisure activity in developed nations. It replaced earlier more social entertainments such as bridge clubs, church groups, and bowling leagues. Putnam argues that as people retreated within their homes and general social participation declined so too did voting.[75]
Rosenstone and Hansen contend that the decline in turnout in the United States is the product of a change in campaigning strategies as a result of the so-called new media. Before the introduction of television, almost all of a party's resources would be directed towards intensive local campaigning and get out the vote initiatives. In the modern era, these resources have been redirected to expensive media campaigns in which the potential voter is a passive participant.[76] During the same period, negative campaigning has become ubiquitous in the United States and elsewhere and has been shown to impact voter turnout.[77] Attack ads and smear campaigns give voters a negative impression of the entire political process. The evidence for this is mixed: elections involving highly unpopular incumbents generally have high turnout; some studies have found that mudslinging and character attacks reduce turnout, but that substantive attacks on a party's record can increase it.[78]
The decline in voter turnout is almost wholly concentrated among working age voters. Those who began voting prior to 1960 maintain the same high turnout rates of that era. For each subsequent generation, starting with the one that came of age in the 1960s, turnout has steadily declined. In the United States recent programs to increase the rates of voting among young people—such as MTV's "Rock the Vote" and the "Vote or Die" initiatives may have marginally increased turnouts of those between the ages of 18 and 25 to vote.[79] A number of governments and electoral commissions have also launched efforts to boost turnout. For instance Elections Canada has launched mass media campaigns to encourage voting prior to elections, as have bodies in Taiwan and the United Kingdom.
Ineligibility
Much of the above analysis is predicated on voter turnout as measured as a percentage of the voting-age population. In a 2001 article in the American Political Science Review, Michael McDonald and Samuel Popkin argued, that at least in the United States, voter turnout since 1972 has not actually declined when calculated for those eligible to vote, what they term the voting-eligible population.[80] In 1972, noncitizens and ineligible felons (depending on state law) constituted about 2% of the voting-age population. By 2004, ineligible voters constituted nearly 10%. Ineligible voters are not evenly distributed across the country – 20% of California's voting-age population is ineligible to vote – which confounds comparisons of states. Furthermore, they argue that an examination of the Census Bureau's Current Population Survey shows that turnout is low but not declining among the youth, when the high youth turnout of 1972 (the first year 18- to 20-year-olds were eligible to vote in most states) is removed from the trendline.
Notes
- 1 2 Niemi and Weisberg p. 31
- ↑ Satoshi Kanazawa. "A Possible Solution to the Paradox of Voter Turnout." The Journal of Politics. p. 974
- ↑ Gelman, Katz, and Teurlinckx. "The Mathematics and Statistics of Voting Power." 'Statistical Science' 2002, vol 17, no 4
- 1 2 Kanazawa p. 975
- ↑ The basic idea behind this formula was developed by Anthony Downs in An Economic Theory of Democracy. published in 1957. The formula itself was developed by William H. Riker and Peter Ordeshook and published in "A Theory of the Calculus of Voting." American Political Science Review. 1968. 62:25–42.
- ↑ Enos, Ryan D.; Fowler, Anthony (11 March 2014). "Pivotality and Turnout: Evidence from a Field Experiment in the Aftermath of a Tied Election" (PDF). Political Science Research and Methods: 1–11. Retrieved 26 July 2014.
- ↑ Riker and Ordeshook, 1968
- ↑ Jankowski, Richard. 2002. "Buying a Lottery Ticket to Help the Poor: Altruism, Civic Duty, and Self-Interest in the Decision to Vote." Rationality and Society 14(1): 55–77.
- ↑ Edlin, Aaron, Andrew Gelman, and Noah Kaplan. 2007. "Voting as a Rational Choice: Why and How People Vote to Improve the Well-Being of Others." Rationality and Society.
- ↑ Fowler, James H. "Altruism and Turnout," Journal of Politics 68 (3): 674–683 (August 2006)
- ↑ Fowler, James H., Kam CD "Beyond the Self: Altruism, Social Identity, and Political Participation," Journal of Politics 69 (3): 811–825 (August 2007)
- ↑ Loewen, PJ "Antipathy, Affinity, and Political Participation," Canadian Journal of Political Science (Forthcoming 2010)
- ↑ http://voluntaryist.com/nonvoting/#.WCkbkC5RLAA
- ↑ See Mark N. Franklin. "Electoral Engineering and Cross National Turnout Differences." British Journal of Political Science, who attempts to challenge some of this consensus
- ↑ CNN – Saddam gets perfect poll result
- ↑ Katz p. 242
- 1 2 Franklin. "Electoral Engineering"
- ↑ Gupta, D. (2004). An analysis of Indian elections, Appendix D. Australia South Asia Research Centre, Australian National University. Retrieved 2008-11-20.
- ↑ Linz, Juan; Alfred Stephan; Yogendra Yadav (2007). Democracy and Diversity. New Delhi: Oxford University Press. p. 99. ISBN 978-0-19-568368-4.
- ↑ Federal Election Commission via National Voter Turnout in Federal Elections: 1960–2008, infoplease.com
- ↑ Fowler, James H. "Habitual Voting and Behavioral Turnout," Journal of Politics 68 (2): 335–344 (May 2006)
- ↑ Plutzer, E. "Becoming a Habitual Voter: Inertia, Resources, and Growth in Young Adulthood." American Political Science Review 96, no. 1 (2002): 41–56.
- 1 2 Sigelman, L., Roeder, P. W., Jewell, M. E., & Baer, M. A. (1985). Voting and nonvoting: A multi-election perspective. American Journal of Political Science, 29(4), 749–765.
- ↑ Fowler, James H.; Laura A. Baker; Christopher T. Dawes (May 2008). "Genetic Variation in Political Participation" (PDF). American Political Science Review. 102 (2): 233–248. doi:10.1017/S0003055408080209.
- ↑ Plutzer "Becoming a Habitual Vote"
- ↑ Fowler, "Habitual Voting and Behavioral Turnout"
- ↑ Fowler, James H.; Christopher T. Dawes (July 2008). "Two Genes Predict Voter Turnout" (PDF). Journal of Politics. 70 (3): 579–594. doi:10.1017/S0022381608080638.
- ↑ Charney, Evan; William English (February 2012). "Candidate Genes and Political Behavior" (PDF). American Political Science Review. 106 (1): 1–34. doi:10.1017/S0003055411000554.
- ↑ Eisinga, R.; Franses, Ph.-H.; Van Dijk, D. (1998). "Timing of vote decision in first and second order Dutch elections 1978–1995. Evidence from artificial neural networks". Political Analysis. 7 (1): 117–142. doi:10.1093/pan/7.1.117.
- ↑ Lijphart. p. 12
- ↑ Gomez, Brad T.; Hansford, Thomas G.; Krause, George A. (2007-08-01). "The Republicans Should Pray for Rain: Weather, Turnout, and Voting in U.S. Presidential Elections". Journal of Politics. 69 (3): 649–663. doi:10.1111/j.1468-2508.2007.00565.x. ISSN 1468-2508.
- ↑ Gatrell, Jay D.; Bierly, Gregory D. (2013-07-03). "Weather and Voter Turnout: Kentucky Primary and General Elections, 1990-2000". Southeastern Geographer. 42 (1): 114–134. doi:10.1353/sgo.2002.0007. ISSN 1549-6929.
- ↑ Artés, Joaquín (2014-06-01). "The rain in Spain: Turnout and partisan voting in Spanish elections". European Journal of Political Economy. 34: 126–141. doi:10.1016/j.ejpoleco.2014.01.005.
- ↑ Eisinga, R.; Te Grotenhuis, M.; Pelzer, B. (2012). "Weather conditions and voter turnout in Dutch national parliament elections, 1971–2010". International Journal of Biometeorology. 56 (4): 783–786. doi:10.1007/s00484-011-0477-7.
- ↑ Eisinga, R.; Te Grotenhuis, M.; Pelzer, B. (2012). "Weather conditions and political party vote share in Dutch national parliament elections, 1971–2010". International Journal of Biometeorology. 56 (6): 1161–1165. doi:10.1007/s00484-011-0504-8.
- ↑ Lasala-Blanco, Narayani; Shapiro, Robert Y.; Rivera-Burgos, Viviana. "Turnout and weather disruptions: Survey evidence from the 2012 presidential elections in the aftermath of Hurricane Sandy". Electoral Studies. doi:10.1016/j.electstud.2016.11.004.
- ↑ G. Bingham Powell "Voter Turnout in Thirty Democracies." in Electoral Participation.
- ↑ Statistics from Mark N. Franklin's "Electoral Participation", found in Controversies in Voting Behavior (2001). Includes only "free" elections
- ↑ "Who voted in previous referendums and elections". Australian Electoral Commission. 9 September 2015.
- ↑ http://www.electionguide.org/countries/id/209/ Republic of China - IFES Election Guide | Country Profile: Taiwan
- ↑ The Guardian
- ↑ United Nations University, p.5
- ↑ IDEA – Regional differences
- ↑ G. Bingham Powell. "American Voter Turnout in Comparative Perspective." The American Political Science Review. 1986 p. 19.
- ↑ Powell "Thirty Democracies." p. 14
- ↑ Powell. p. 13
- ↑ U.S. Bureau of the Census, Statistical Abstract of the United States, 1982–83, Table no.804, p.492
- ↑ HoR TURNOUT BY DIVISION, AEC
- ↑ SENATE TURNOUT BY DIVISION, AEC
- ↑ The Guardian Compulsory voting around the world
- ↑ Sarah Birch, Full Participation. A comparative study of compulsory voting, United Nations University, p.5
- ↑ Mark N. Franklin. "Electoral Participation." in Controversies in Voting Behavior p. 87
- ↑ Richard S. Katz. Democracy and Elections. New York: Oxford University Press, 1997.
- ↑ Robert W. Jackman and Ross A. Miller. "Voter Turnout in the Industrial Democracies During the 1980s." in Elections and Voting Behaviour: New Challenges, New Perspectives. p. 308
- ↑ Katz p. 240
- ↑ "Unequal Participation: Democracy's Unresolved Dilemma," in American Political Science Review (March 1997).
- ↑ AU: ANDRÉ BLAIS AU: R. K. CARTY TI: Does proportional representation foster voter turnout? SO: European Journal of Political Research VL: 18 NO: 2 PG: 167–181 YR: 1990 ON: 1475-6765 PN: 0304-4130 AD: Université de Montréal, Canada;; University of British Columbia, Canada doi:10.1111/j.1475-6765.1990.tb00227.x
- ↑ Powell "Thirty Democracies." p. 12
- ↑ Richard G. Niemi and Herbert F. Weisberg. Controversies in Voting Behavior p. 31
- ↑ "Internet voting is just too hackable, say security experts". USA TODAY. Retrieved 2016-03-22.
- ↑ "Voting Drops 83 Percent In All-Digital Election". 26 May 2009. KITV News. Retrieved 2 September 2013.
- ↑ Franklin "Electoral Participation." p. 98
- ↑ Arend Lijphart. "Unequal Participation: Democracy's Unresolved Dilemma." American Political Science Review.
- ↑ Kimball W. Brace, Overview of Voting Equipment Usage in United States, Direct Recording Electronic (DRE) Voting, statement to the Election Assistance Commission, May 5, 2004.
- ↑ Douglas W. Jones, Human Factors in Voting Technology, presentation to the Council on Governmental Ethics Laws September 29, 2002, Ottawa Canada.
- ↑ Katz p. 239
- ↑ Niemi and Weisberg "Introduction." Controversies in Voting Behavior. p. 25
- ↑ McDonald "2004 Voting-Age and Voting-Eligible Population Estimates and Voter Turnout" http://elections.gmu.edu/Voter_Turnout_2004.htm
- ↑ Katz p. 334
- ↑ Robert D. Putnam "Tuning In, Tuning Out: The Strange Disappearance of Social Capital in America." in Controversies in Voting Behavior p. 40
- ↑ Niemi and Weisberg. p. 30
- ↑ Walter Dean Burnham. "The Appearance and Disappearance of the American Voter."
- ↑ Lijphart p. 6
- ↑ Sclove p. 241
- ↑ Putnam p. 61
- ↑ Steven J. Rosenstone and John Mark Hansen. "Solving the Puzzle of Participation in Electoral Politics." p. 73
- ↑ Yanna Krupnikov. ""When Does Negativity Demobilize? Tracing the Conditional Effect of Negative Campaigning on Voter Turnout." American Journal of Political Science, Volume 55, Issue 4, pages 797–813, October 2011.
- ↑ Niemi and Weisberg p. 30.
- ↑ Eisner, Jane. "Rock the Vote, now 15, eager to help drive policy." Philadelphia Inquirer 12 June 2005. 12 July 2005
- ↑ Michael McDonald and Samual Popkin. "The Myth of the Vanishing Voter" in American Political Science Review.
References
- Franklin, Mark N. "Electoral Engineering and Cross National Turnout Differences." British Journal of Political Science. 1999
- Kanazawa, Satoshi. "A Possible Solution to the Paradox of Voter Turnout." The Journal of Politics.
- Lijphart, Arend. "Unequal Participation: Democracy's Unresolved Dilemma." American Political Science Review. vol. 91 (March 1997): 1–14. p. 12
- McDonald, Michael and Samuel Popkin. "The Myth of the Vanishing Voter." American Political Science Review. 2001.
- Niemi, Richard G. and Herbert F. Weisberg. eds. Controversies in Voting Behavior. Washington, D.C: CQ Press, 2001.
- Norris, Pippa. Elections and Voting Behaviour: New Challenges, New Perspectives. Aldershot: Ashgate, Dartmouth, 1998.
- Rose, Richard, ed. Electoral Participation: A Comparative Analysis. Beverly Hills: Sage Publications, 1980.
- Wolfinger, Raymond E. and Steven J. Rosenstone. 1980. Who Votes? New Haven, CT: Yale University Press.
- Wolfinger, R., Glass, D., Squire, P.(1990). Predictors of electoral turnout:an international comparison. Policy Studies Review, 9(3), p551–574, 24p
- Highton, B. (1997, May). Easy registration and voter turnout. The Journal of Politics, 59(2), pp. 565–575.
Further reading
| Wikimedia Commons has media related to Voter turnout. |
alphabetical by title and work
- Charles Q. Choi (November 2007). "The Genetics of Politics". Scientific American (Print). Scientific American, Inc. pp. 18, 21.
...the desire to vote or abstain from politics might largely be hardwired into our biology
- Philip Lampi (2008-05-29). "A New Nation Votes: American Elections Returns 1787–1825". Digital Collections and Archives. Tufts University. Retrieved 2008-06-24.
A New Nation Votes is a searchable collection of election returns from the earliest years of American democracy.
- "The Power Report". makeitanissue.org.uk. The Power Inquiry. 2007-01-19. Retrieved 2008-06-24.
The Power Commission was established to discover what is happening to our democracy. It sought to establish why people were disengaging from formal democratic politics in Britain and how these trends could be reversed.
- "Voter Turnout". ElectionGuide. International Foundation for Electoral Systems. Retrieved 2008-06-24.
...ElectionGuide is the most comprehensive and timely source of verified election information and results available online.
- "Voter Turnout". FairVote. Voting and Democracy Research Center. Retrieved 2008-06-24.
Voter Turnout is a fundamental quality of fair elections and is generally considered to be a necessary factor for a healthy democracy.
- "Voter Turnout". International IDEA website. International Institute for Democracy and Electoral Assistance. 2008-06-16. Retrieved 2008-06-23.
The International IDEA Voter Turnout Website contains the most comprehensive global collection of political participation statistics available.
- Michael McDonald (2008-04-01). "Voter Turnout". United States Elections Project. Retrieved 2008-06-24.
Statistics on voter turnout presented here show that the much-lamented decline in voter participation is an artifact of the way in which it is measured.
- Rhonda Parkinson (2007-03-01). "Voter Turnout in Canada". Maple Leaf Web. Retrieved 2008-06-23.
Since the 1980s, voter turnout in federal elections has fallen sharply.