Calgary Southeast
For the provincial electoral district, see Calgary-South East.
|
Calgary Southeast in relation to the other Calgary ridings | |
| Defunct federal electoral district | |
| Legislature | House of Commons |
| District created | 1986 |
| District abolished | 2013 |
| First contested | 1988 |
| Last contested | 2011 |
| Demographics | |
| Population (2011)[1] | 152,929 |
| Electors (2011) | 104,604 |
| Area (km²)[2] | 115.50 |
| Census divisions | Division No. 6 |
| Census subdivisions | Calgary |
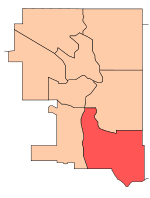
Calgary Southeast was a federal electoral district in Alberta, Canada, that was represented in the House of Commons of Canada from 1988 to 2015. The district was in the southeast part of the City of Calgary. It was bounded by the city limits to the south and east.
History
The electoral district was created in 1986 from Calgary East, Bow River and Calgary South ridings.
In 1996, parts were transferred from this electoral district to Calgary East.
Members of Parliament
This riding has elected the following Members of Parliament:
| Parliament | Years | Member | Party | |
|---|---|---|---|---|
| Calgary Southeast Riding created from Calgary East, Bow River and Calgary South |
||||
| 34th | 1988–1993 | Lee Richardson | Progressive Conservative | |
| 35th | 1993–1996 | Jan Brown | Reform | |
| 1996–1996 | Independent Reform | |||
| 1996–1997 | Independent | |||
| 36th | 1997–2000 | Jason Kenney | Reform | |
| 2000–2000 | Alliance | |||
| 37th | 2000–2003 | |||
| 2003–2004 | Conservative | |||
| 38th | 2004–2006 | |||
| 39th | 2006–2008 | |||
| 40th | 2008–2011 | |||
| 41st | 2011–2015 | |||
| Riding dissolved into Calgary Shepard and Calgary Midnapore | ||||
Election results
| Canadian federal election, 2011 | ||||||||
|---|---|---|---|---|---|---|---|---|
| Party | Candidate | Votes | % | ∆% | Expenditures | |||
| Conservative | Jason Kenney | 48,173 | 76.26 | +2.43 | $54,158 | |||
| New Democratic | Kirk Oates | 6,482 | 10.26 | +3.07 | $5 | |||
| Green | Brett Spencer | 4,079 | 6.46 | -3.80 | $5,584 | |||
| Liberal | Brian MacPhee | 4,020 | 6.36 | -2.36 | $11,237 | |||
| Independent | Antoni Grochowski | 225 | 0.36 | * | ||||
| Western Block | Paul Fromm | 193 | 0.31 | * | $5,393 | |||
| Total valid votes/Expense limit | 63,172 | 100.00 | – | $104,090 | ||||
| Total rejected ballots | 129 | 0.20 | – | |||||
| Turnout | 63,301 | 60.32 | – | |||||
| Eligible voters | 104,941 | – | – | |||||
| Canadian federal election, 2008 | ||||||||
|---|---|---|---|---|---|---|---|---|
| Party | Candidate | Votes | % | ∆% | Expenditures | |||
| Conservative | Jason Kenney | 41,322 | 73.83 | -1.35 | $40,322 | |||
| Green | Margaret Chandler | 5,744 | 10.26 | +3.45 | $3,529 | |||
| Liberal | Brad Carroll | 4,880 | 8.72 | -1.63 | ||||
| New Democratic | Chris Willott | 4,024 | 7.19 | -0.48 | $5,082 | |||
| Total valid votes/Expense limit | 55,970 | 100.00 | $96,650 | |||||
| Total rejected ballots | – | – | ||||||
| Turnout | – | – | ||||||
| Canadian federal election, 2006 | ||||||||
|---|---|---|---|---|---|---|---|---|
| Party | Candidate | Votes | % | ∆% | Expenditures | |||
| Conservative | Jason Kenney | 44,987 | 75.18 | +4.19 | $46,829 | |||
| Liberal | James Ludwar | 6,193 | 10.35 | -6.00 | $9,186 | |||
| New Democratic | Eric Leavitt | 4,584 | 7.67 | +1.09 | $2,949 | |||
| Green | Gus Gutoski | 4,076 | 6.81 | +0.76 | $1,535 | |||
| Total valid votes | 59,840 | 100.00 | ||||||
| Total rejected ballots | 120 | 0.20 | ||||||
| Turnout | 59,960 | 67.08 | ||||||
| Canadian federal election, 2004 | ||||||||
|---|---|---|---|---|---|---|---|---|
| Party | Candidate | Votes | % | ∆% | Expenditures | |||
| Conservative | Jason Kenney | 36,843 | 70.99 | -13.06 | $47,525 | |||
| Liberal | Jim Tanner | 8,488 | 16.35 | +4.17 | $23,178 | |||
| New Democratic | Brian Pincott | 3,419 | 6.58 | +4.55 | $2,401 | |||
| Green | George Read | 3,142 | 6.05 | +4.35 | $1,193 | |||
| Canadian Action | Trevor Grover | 274 | 0.53 | – | ||||
| Total valid votes | 51,892 | 100.00 | ||||||
| Total rejected ballots | 119 | 0.23 | ||||||
| Turnout | 52,011 | 63.72 | ||||||
Note: Conservative vote is compared to the total of Progressive Conservative and Canadian Alliance vote in 2000.
| Canadian federal election, 2000 | ||||||||
|---|---|---|---|---|---|---|---|---|
| Party | Candidate | Votes | % | ∆% | Expenditures | |||
| Alliance | Jason Kenney | 34,492 | 63.24 | +8.22 | $41,614 | |||
| Progressive Conservative | Ray Clark | 11,353 | 20.81 | -2.82 | $9,884 | |||
| Liberal | Dana Peace | 6,646 | 12.18 | -6.00 | $18,677 | |||
| New Democratic | Giorgio Cattabeni | 1,111 | 2.03 | -0.60 | $490 | |||
| Green | James Stephen Kohut | 931 | 1.70 | – | ||||
| Total valid votes | 54,533 | 100.00 | ||||||
| Total rejected ballots | 116 | 0.21 | ||||||
| Turnout | 54,649 | 63.89 | ||||||
Note: Canadian Alliance vote is compared to the Reform vote in 1997.
| Canadian federal election, 1997 | ||||||||
|---|---|---|---|---|---|---|---|---|
| Party | Candidate | Votes | % | ∆% | Expenditures | |||
| Reform | Jason Kenney | 24,602 | 55.02 | -4.83 | $54,180 | |||
| Progressive Conservative | Carol Kraychy | 10,567 | 23.63 | +3.51 | $60,861 | |||
| Liberal | Patti-Anne Kay | 8,131 | 18.18 | +4.55 | $43,986 | |||
| New Democratic | Jason Ness | 1,176 | 2.63 | -0.74 | $524 | |||
| Natural Law | Neeraj Varma | 235 | 0.52 | -0.27 | ||||
| Total valid votes | 44,711 | 100.00 | ||||||
| Total rejected ballots | 79 | 0.18 | ||||||
| Turnout | 44,790 | 63.69 | ||||||
| Canadian federal election, 1993 | ||||||||
|---|---|---|---|---|---|---|---|---|
| Party | Candidate | Votes | % | ∆% | ||||
| Reform | Jan Brown | 33,565 | 59.85 | +47.02 | ||||
| Progressive Conservative | Lee Richardson | 11,286 | 20.12 | -42.54 | ||||
| Liberal | Quoi Nguyen | 7,642 | 13.63 | +3.39 | ||||
| New Democratic | Neale Smith | 1,889 | 3.37 | -9.82 | ||||
| National | Jocelyne Wandler | 1,109 | 1.98 | |||||
| Natural Law | Maureen Doram | 444 | 0.79 | |||||
| Canada Party | Peter Hope | 148 | 0.26 | |||||
| Total valid votes | 56,083 | 100.00 | ||||||
| Canadian federal election, 1988 | ||||||||
|---|---|---|---|---|---|---|---|---|
| Party | Candidate | Votes | % | |||||
| Progressive Conservative | Lee Richardson | 32,477 | 62.67 | |||||
| New Democratic | Kathy Miller | 6,837 | 13.19 | |||||
| Reform | Gerry Maloney | 6,648 | 12.83 | |||||
| Liberal | Dale Muti | 5,305 | 10.24 | |||||
| Rhinoceros | Dave Wylie | 299 | 0.58 | |||||
| Independent | Julie Northrup | 77 | 0.15 | |||||
| Confederation of Regions | Douglas M. Cassidy | 62 | 0.12 | |||||
| Independent | Jim Othen | 62 | 0.12 | |||||
| Commonwealth of Canada | Eldon Warman | 58 | 0.11 | |||||
| Total valid votes | 51,825 | 100.00 | ||||||
See also
- List of Canadian federal electoral districts
- Alberta federal electoral districts
- Past Canadian electoral districts
References
- "(Code 48007) Census Profile". 2011 census. Statistics Canada. 2012. Retrieved 2011-03-06.
- Riding history for Calgary Southeast from the Library of Parliament
- Expenditures -2008
- Expenditures - 2004
- Expenditures - 2000
- Expenditures - 1997
Notes
- ↑ Statistics Canada: 2012
- ↑ Statistics Canada: 2012
External links
- Elections Canada
- Website of the Parliament of Canada
.png)
.png)
This article is issued from Wikipedia - version of the 8/5/2016. The text is available under the Creative Commons Attribution/Share Alike but additional terms may apply for the media files.