This article is about the electoral district in Canadian province of Manitoba. For other uses, see
Provenchère.
Provencher Manitoba electoral district Manitoba electoral district |
|---|
|
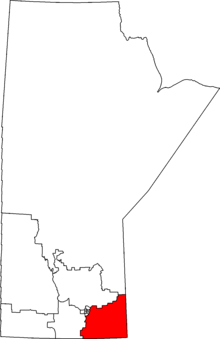
Provencher in relation to other Manitoba federal electoral districts as of the 2013 Representation Order. |
| Federal electoral district |
|---|
| Legislature |
House of Commons |
|---|
| MP |
Ted Falk
Conservative |
|---|
| District created |
1871 |
|---|
| First contested |
1871 |
|---|
| Last contested |
2015 |
|---|
| District webpage |
profile, map |
|---|
| Demographics |
|---|
| Population (2011)[1] |
88,640 |
|---|
| Electors (2015) |
63,356 |
|---|
| Area (km²)[1] |
18,773 |
|---|
| Pop. density (per km²) |
4.7 |
|---|
| Census divisions |
Division No. 1, Division No. 2, Division No. 3, Division No. 12, Division No. 19 |
|---|
| Census subdivisions |
Alexander, Buffalo Point 36, De Salaberry, Division No. 1, Unorganized, Division No. 19, Unorganized, Emerson, Franklin, Hanover, La Broquerie, Lac du Bonet (RM), Lac du Bonnet (town), Montcalm, Morris (town), Morris (RM), Niverville, Pinawa, Piney, Powerview-Pine Falls, Reynolds, Ritchot, Roseau River 2, Roseau Rapids 2A, Shoal Lake (Part) 40, Springfield, Ste. Anne (RM), Ste. Anne (town), Steinbach, St-Pierre-Jolys, Stuartburn, Taché |
|---|
Provencher is a federal electoral district in Manitoba, Canada, that has been represented in the House of Commons of Canada since 1871. It is primarily a rural district. Its largest community is the city of Steinbach.
Geography
The district is in the most southeastern part of Manitoba.
Demographics
- According to the Canada 2011 Census
Ethnic groups: 85.3% White, 12.3% Aboriginal
Languages: 67.7% English, 17.3% German, 10.5% French, 1.2% Russian, 1.1% Ukrainian
Religions: 79.6% Christian (35.8% "Other Christian", 23.6% Catholic, 6.3% United Church, 4.8% Lutheran, 2.5% Anglican, 2.2% Baptist), 19.5% None.
Median income: $29,184 (2010)[2]
Average income: $36,186 (2010) [2]
History
The electoral district was created in 1871 after Manitoba joined the Canadian Confederation in 1870. It is notable for being the district that elected Louis Riel to the House of Commons.
The riding elected Liberal Party of Canada MPs from 1904–1957, but for the better part of the last half-century has been one of the more conservative ridings in Manitoba and all of Canada. Nevertheless, the riding has fallen to the Liberals at high-tide elections, such as from 1968–1972 and 1993–2000.
This riding lost territory to Selkirk—Interlake—Eastman and Portage—Lisgar, and gained territory from Selkirk—Interlake during the 2012 electoral redistribution.
Members of Parliament
This riding has elected the following Members of Parliament:
Election results
| Canadian federal by-election, November 25, 2013 |
| Party |
Candidate |
Votes | % | ∆% | Expenditures |
|
Conservative | Ted Falk | 13,046 | 58.20 | −12.40 | $ 83,542.19 |
|
Liberal | Terry Hayward | 6,711 | 29.94 | +23.23 | 66,455.27 |
|
New Democratic | Natalie Courcelles Beaudry | 1,843 | 8.22 | −9.67 | 17,878.16 |
|
Green | Janine Gibson | 817 | 3.64 | +0.69 | 1,074.97 |
| Total valid votes/Expense limit |
22,417 | 100.0 | – | $ 97,453.98 |
| Total rejected ballots |
136 | 0.60 | +0.17 |
| Turnout |
22,553 | 33.85 | −27.88 |
| Eligible voters |
66,624 | | |
|
Conservative hold |
Swing |
−17.86 |
| By-election due to the resignation of Vic Toews. |
|
Minister of Public Safety Vic Toews resigned from cabinet and as an MP, effective July 9, 2013, to spend more time with his family and join the private sector.[5]
| Canadian federal election, 2011 |
| Party |
Candidate |
Votes | % | ∆% | Expenditures |
|
Conservative | Vic Toews | 27,820 | 70.60 | +5.95 | $70,719.84 |
|
New Democratic | Al Mackling | 7,051 | 17.89 | +4.17 | $14,274.04 |
|
Liberal | Terry Hayward | 2,645 | 6.71 | -5.86 | $25,938.56 |
|
Green | Janine Gibson | 1,164 | 2.95 | -2.84 | $210.00 |
|
Christian Heritage | David Reimer | 510 | 1.29 | -1.95 | $8,372.94 |
|
Pirate | Ric Lim[7] | 215 | 0.55 | – | $393.24 |
| Total valid votes/Expense limit |
39,405 | 100.0 | – | $ 90,198.71 |
| Total rejected ballots |
169 | 0.43 | -0.00 |
| Turnout |
39,574 | 61.73 | +5.63 |
| Eligible voters |
64,104 | | |
|
Conservative hold |
Swing |
+0.89
|
| Canadian federal election, 2008 |
| Party |
Candidate |
Votes | % | ∆% | Expenditures |
|
Conservative | Vic Toews | 23,303 | 64.65 | -1.03 | $67,419 |
|
New Democratic | Ross Martin | 4,947 | 13.72 | +0.01 | $6,406 |
|
Liberal | Shirley Hiebert | 4,531 | 12.57 | -3.27 | $16,369 |
|
Green | Janine Gibson | 2,089 | 5.79 | +1.02 | $1,093 |
|
Christian Heritage | David Reimer | 1,170 | 3.24 | – | $10,130 |
| Total valid votes/Expense limit |
36,040 | 100.0 | – | $87,213 |
| Total rejected ballots |
156 | 0.43 | +0.02 |
| Turnout |
36,196 | 58.01 | -7.04 |
| Canadian federal election, 2006: Provencher |
| Party |
Candidate |
Votes | % | ∆% | Expenditures |
|
Conservative | Vic Toews | 25,199 | 65.68 | +2.66 | $40,862.19 |
|
Liberal | Wes Penner | 6,077 | 15.84 | −9.08 | $75,239.46 |
|
New Democratic | Patrick O'Connor | 5,259 | 13.71 | +4.70 | $2,266.71 |
|
Green | Janine Gibson | 1,830 | 4.77 | +1.72 | $87.31 |
| Total valid votes |
38,365 | 100.00 |
| Total rejected ballots |
157 | 0.41 | −0.02 |
| Turnout |
38,522 | 65.05 | +5.38 |
| Electors on the lists |
59,216 |
| Sources: Official Results, Elections Canada and Financial Returns, Elections Canada. |
| Canadian federal election, 2004: Provencher |
| Party |
Candidate |
Votes | % | ∆% | Expenditures |
|
Conservative | Vic Toews | 22,694 | 63.02 | +4.99 | $70,851.00 |
|
Liberal | Peter Epp | 8,975 | 24.92 | −10.94 | $64,895.23 |
|
New Democratic | Sarah Zaharia | 3,244 | 9.01 | +2.90 | $1,472.79 |
|
Green | Janine Gibson | 1,100 | 3.05 | – | $480.59 |
| Total valid votes |
36,013 | 100.00 |
| Total rejected ballots |
155 | 0.43 | +0.07 |
| Turnout |
36,168 | 59.67 | −10.36 |
| Electors on the lists |
60,617 |
| Percentage change figures are factored for redistribution. Conservative Party percentages are contrasted with the combined Canadian Alliance and Progressive Conservative percentages from 2000. |
| Sources: Official Results, Elections Canada and Financial Returns, Elections Canada. |
Note: Conservative vote is compared to the total of the Canadian Alliance vote and Progressive Conservative vote in 2000 election.
| Canadian federal election, 2000: Provencher |
| Party |
Candidate |
Votes | % | ∆% | Expenditures |
|
Alliance | Vic Toews | 21,358 | 52.76 | +17.68 | $65,896.75 |
|
Liberal | David Iftody | 14,419 | 35.62 | −4.38 | $60,917.43 |
| |
Progressive Conservative |
Henry C. Dyck |
2,726 |
6.73 |
−9.59 |
$7,780.05 |
|
New Democratic | Peter Hiebert | 1,980 | 4.89 | −3.71 | $210.45 |
| Total valid votes |
40,483 | 100.00 |
| Total rejected ballots |
148 | 0.36 | −0.10 |
| Turnout |
40,631 | 70.03 | +5.09 |
| Electors on the lists |
58,020 |
| Sources: Official Results, Elections Canada and Financial Returns, Elections Canada. |
Note: Canadian Alliance vote is compared to the Reform vote in 1997 election.
| Canadian federal election, 1997: Provencher |
| Party |
Candidate |
Votes | % | ∆% | Expenditures |
|
Liberal | David Iftody | 14,595 | 40.00 | −0.82 | $61,072 |
|
Reform | Larry Tardiff | 12,798 | 35.08 | −2.09 | $42,111 |
| |
Progressive Conservative |
Clare Braun |
5,955 |
16.32 |
+5.43 |
$60,432 |
|
New Democratic | Martha Wiebe Owen | 3,137 | 8.60 | +1.62 | $1,793 |
| Total valid votes |
36,485 | 100.00 |
| Total rejected ballots |
170 | 0.46 | +0.13 |
| Turnout |
36,655 | 64.94 | −5.61 |
| Electors on the lists |
56,442 |
| Percentage change figures are factored for redistribution. |
| Sources: Official Results, Elections Canada and Financial Returns, Elections Canada. |
| Canadian federal election, 1993: Provencher |
| Party |
Candidate |
Votes | % | ∆% | Expenditures |
|
Liberal | David Iftody | 16,119 | 44.04 | +11.5 | $42,045 |
|
Reform | Dean Whiteway | 13,463 | 36.78 | +33.1 | $49,513 |
| |
Progressive Conservative |
Kelly Clark |
3,765 |
10.29 |
−45.2 |
$48,359 |
|
New Democratic | Martha Wiebe Owen | 1,818 | 4.97 | −2.3 | $7,277 |
|
National | Wes Penner | 1,212 | 3.3 | | $23,719 |
|
Natural Law | Corrine Ayotte | 157 | 0.43 | +0.1 | $12 |
|
Canada Party | Ted Bezan | 69 | 0.19 | – | $0 |
| Total valid votes |
36,603 | 100.00 |
| Total rejected ballots |
126 | 0.34 | +0.0 |
| Turnout |
36,729 | 69.52 | −1.4 |
| Electors on the lists |
52,835 |
| Source: Thirty-fifth General Election, 1993: Official Voting Results, Published by the Chief Electoral Officer of Canada. Financial figures taken from official contributions and expenses provided by Elections Canada. |
Note: NDP vote is compared to CCF vote in 1958 election.
Note: Progressive Conservative vote is compared to "National Government" vote in 1940 election. Social Credit vote is compared to New Democracy vote in 1940 election.
Note: "National Government" vote is compared to Conservative vote in 1935 election.
Note: Unionist vote is compared to Conservative vote in 1911 election.
| Canadian federal by-election, 24 January 1889 |
| Party |
Candidate |
Votes | % | ∆% |
| On Mr. Royal being appointed Lieutenant-Governor of the North West Territories |
|
Conservative | Alphonse-Alfred-Clément Larivière | 797 | 48.3 | -9.8 |
|
Unknown | Richard | 583 | 35.4 | – |
|
Unknown | Clarke | 269 | 16.3 | – |
| Total valid votes |
1,649 | 100.0 |
| Canadian federal by-election, 30 December 1879 |
| Party |
Candidate |
Votes | % |
|
Conservative | Joseph Royal | 652 | 62.6 |
|
Unknown | John Molloy | 269 | 25.8 |
|
Unknown | S. Hamelin | 121 | 11.6 |
| Total valid votes |
1,042 | 100.0 |
| Called upon Mr. Dubuc being appointed Puisne Judge of the Court of Queen's Bench for Manitoba. |
| By-election on 31 March 1875
On Mr. Riel being unseated and declared an outlaw, 25 February 1875 |
| Party |
Candidate |
Votes
|
|
Liberal | Andrew Bannatyne | acclaimed |
| By-election on 3 September 1874
On Mr. Riel being expelled from the House of Commons, 16 April 1874 |
| Party |
Candidate |
Votes
|
|
Independent | Louis Riel | acclaimed |
| By-election on 13 October 1873
On Mr. Cartier's death, 20 May 1873 |
| Party |
Candidate |
Votes
|
|
Independent | Louis Riel | acclaimed |
| Canadian federal by-election, 3 March 1871 |
| Party |
Candidate |
Votes | % |
|
Conservative | Pierre Delorme | 172 | 85.6 |
|
Liberal | William Dease | 29 | 14.4 |
| Total valid votes |
201 | 100.0 |
| Called as a result of Manitoba joining Confederation, 15 July 1870. |
See also
References
Notes
External links
Coordinates: 49°41′46″N 95°54′36″W / 49.696°N 95.910°W / 49.696; -95.910