Terrain cartography

Terrain or relief is an essential aspect of physical geography, and as such its portrayal presents a central problem in cartography, and more recently GIS and geovisualization.
The most obvious way to depict relief is to imitate it at scale, as in molded or sculpted solid terrain models and molded-plastic raised-relief maps. Because of the disparity between the horizontal and vertical scales of maps, raised relief is typically exaggerated.
On flat paper maps and computer screens, terrain can be depicted in a variety of ways, outlined below.
Hill profiles

The most ancient form of relief depiction in cartography, hill profiles are simply illustrations of mountains and hills in profile, placed as appropriate on generally small-scale (broad area of coverage) maps. They are seldom used today except as part of an "antique" styling.
Hachures

Hachures are also an older mode of representing relief. They are a form of shading, although different from the one used in shaded maps. They show the orientation of slope, and by their thickness and overall density they provide a general sense of steepness. Being non-numeric, they are less useful to a scientific survey than contours, but can successfully communicate quite specific shapes of terrain.
Hachure representation of relief was standardized by the Austrian topographer Johann Georg Lehmann in 1799.
Contour lines
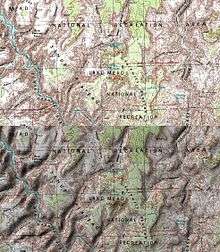
Contour lines (or isohypses) are isolines showing equal elevation. This is the most common way of numerically showing elevation, and is familiar from topographic maps.
Most 18th and early 19th century national surveys did not record relief across the entire area of coverage, calculating only spot elevations at survey points. The United States Geological Survey (USGS) topographical survey maps included contour representation of relief, and so maps that show relief, especially with exact representation of elevation, came to be called topographic maps (or "topo" maps) in the United States, and the usage has spread internationally.
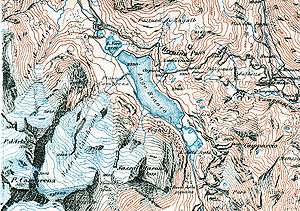
On maps produced by Swisstopo, the color of the contour lines is used to indicate the type of ground: black for bare rock and scree, blue for ice and underwater contours, brown for earth-covered ground.[1]
Hypsometric tints
Hypsometric tints are colors used to indicate elevation, usually together with contour lines. They can be used to depict ranges of elevation as bands of color, usually in a graduated scheme, or as a color ramp applied to contour lines themselves. A typical scheme progresses from dark greens for lower elevations up through yellows/browns, and on to grays and white at the highest elevations. Hypsometric tinting of maps and globes is often accompanied by a similar method of bathymetric tinting to convey depth of oceans; lighter shades of blue represent shallower water such as the continental shelf and darker shades deeper regions.
Shaded relief
Bottom: the same map with sun shading
Shaded relief, or hill-shading, simulates the cast shadow thrown upon a raised relief map, or more abstractly upon the planetary surface represented. The shadows normally follow the English convention of top-left lighting in which the light source is placed near the upper-left corner of the map. If the map is oriented with north at the top, the result is that the light appears to come from the north-west. Many people have pointed out that this is unrealistic for maps of the northern hemisphere, because the sun does not shine from that direction, and they have proposed using southern lighting. However, the normal convention is followed to avoid multistable perception illusions (i.e. crater/hill confusion).[2]
Traditionally drawn with charcoal, airbrush and other artist's media, shaded relief is today almost exclusively computer-generated using digital elevation models, with a resulting different look and feel. Much work has been done in digitally recreating the work of Swiss master Eduard Imhof, widely regarded as the master of manual hill-shading technique and theory. Imhof's contributions included a multi-color approach to shading, with purples in valleys and yellows on peaks.
The use of illumination and shadow to produce an appearance of three-dimensional space on a flat-surfaced map closely parallels the painting technique known as chiaroscuro.
Shaded relief today can be created digitally, using a digital elevation model (DEM) as its basis. The DEM may be converted to shaded relief using software such as Photoshop, QGIS, GRASS GIS or ArcMap's Spatial Analyst extension.
Physiographic illustration
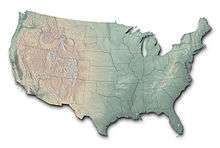
Pioneered by Erwin Raisz, this technique uses generalized texture to imitate landform shapes over a large area. A combination of hill profile and shaded relief, this style of terrain representation is simultaneously idiosyncratic to its creator -- often hand-painted -- and found insightful in illustrating geomorphological patterns.
More recently, Tom Patterson created a computer-generated map of the United States using Erwin Raisz's work as a starting point, the Physical Map of the Coterminous United States; he called the technique plan oblique relief.
Skeletal, structural, or break lines
Emphasizes hydrological drainage divide and watershed streams.
Forums and associations
Portrayal of relief is especially important in mountainous regions. The Commission on Mountain Cartography of the International Cartographic Association is the best-known forum for discussion of theory and techniques for mapping these regions.
See also
References
- ↑ Swisstopo, Conventional Signs. Archived May 28, 2008, at the Wayback Machine.
- ↑ Eduard Imhof (2007-06-01). Cartographic relief presentation. Esri Pr. ISBN 978-1-58948-026-1.
External links
| Wikimedia Commons has media related to Topographic shading. |
- Shaded Relief, a website by Tom Patterson
- Relief Shading, a website of the Institute of Cartography at ETH Zurich
- Wikipedia Graphic Lab, tutorial on creating shaded relief maps using free and open source software
- Rendering a map using relief shading technique in Photoshop