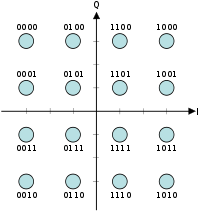
Constellation diagram
[1] A constellation diagram is a representation of a signal modulated by a digital modulation scheme such as quadrature amplitude modulation or phase-shift keying. It displays the signal as a two-dimensional X-Y plane scatter diagram in the complex plane at symbol sampling instants. In a more abstract sense, it represents the possible symbols that may be selected by a given modulation scheme as points in the complex plane. Measured constellation diagrams can be used to recognize the type of interference and distortion in a signal.

By representing a transmitted symbol as a complex number and modulating a cosine and sine carrier signal with the real and imaginary parts (respectively), the symbol can be sent with two carriers on the same frequency. They are often referred to as quadrature carriers. A coherent detector is able to independently demodulate these carriers. This principle of using two independently modulated carriers is the foundation of quadrature modulation. In pure phase modulation, the phase of the modulating symbol is the phase of the carrier itself and this is the best representation of the modulated signal.
As the symbols are represented as complex numbers, they can be visualized as points on the complex plane. The real and imaginary axes are often called the in phase, or I-axis, and the quadrature, or Q-axis, respectively. Plotting several symbols in a scatter diagram produces the constellation diagram. The points on a constellation diagram are called constellation points. They are a set of modulation symbols which compose the modulation alphabet.
Also a diagram of the ideal positions, signal space diagram, in a modulation scheme can be called a constellation diagram. In this sense the constellation is not a scatter diagram but a representation of the scheme itself. The example shown here is for 8-PSK, which has also been given a Gray coded bit assignment.
Interpretation

Upon reception of the signal, the demodulator examines the received symbol, which may have been corrupted by the channel or the receiver (e.g. additive white Gaussian noise, distortion, phase noise or interference). It selects, as its estimate of what was actually transmitted, that point on the constellation diagram which is closest (in a Euclidean distance sense) to that of the received symbol. Thus it will demodulate incorrectly if the corruption has caused the received symbol to move closer to another constellation point than the one transmitted.
This is maximum likelihood detection. The constellation diagram allows a straightforward visualization of this process — imagine the received symbol as an arbitrary point in the I-Q plane and then decide that the transmitted symbol is whichever constellation point is closest to it.
For the purpose of analyzing received signal quality, some types of corruption are very evident in the constellation diagram. For example:
- Gaussian noise shows as fuzzy constellation points
- Non-coherent single frequency interference shows as circular constellation points
- Phase noise shows as rotationally spreading constellation points
- Attenuation causes the corner points to move towards the center
A constellation diagram visualises phenomena similar to those an eye pattern does for one-dimensional signals. The eye pattern can be used to see timing jitter in one dimension of modulation.