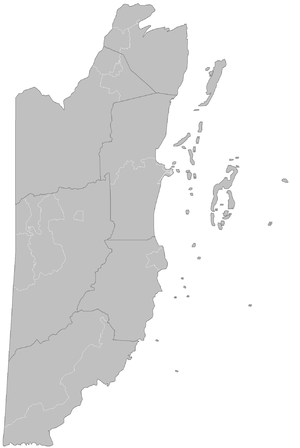
Constituencies of Belize
 |
| This article is part of a series on the politics and government of Belize |
Belize's 6 districts are politically divided into 31 constituencies. Each constituency sends one representative to Belize's House of Representatives for 5-year terms. This election is known as the General Election. Each person (who is eligible to vote) votes for the candidate they would want to represent their constituency in Central Government.
Each political party nominates a candidate or Standard Bearer for each constituency. The winner becomes the Area Representative of the constituency, while the loser generally remains the Standard Bearer of that constituency for his/her political party.
Division of constituencies
Belize's constituencies are divided in such a way that their voting population be as equal as possible to each other ensuring, theoretically, that resources are equally shared among the country's citizens, as required by the constitution. After the 2003 General Elections two additional constituencies were created from territory of existing constituencies in order to further ensure the equality of the voting populations among the constituencies. Coming out of January 2008, the most populous constituency (Stann Creek West) had a voting population of 7,085 while the least populous constituency (Fort George) had a voting population of 3,195.[1]
New constituencies
In Belize's 2003 General Elections, 29 constituencies voted in their Area Representatives for Belize's House of Representatives. Since then it was noted that the difference in voting populations between the most and least populous constituencies was rather large (Cayo South then had 8,000 voters compared to Pickstock's 1000+). In 2004 a Task Force was appointed by the Elections and Boundaries Commission to study the matter. Their Final Report was submitted in October 2004. It is noted that the Elections and Boundaries Department has the right to occasionally reassess constituencies, usually after the latest census or population estimate.
Among several things that their report suggested, the expansion of the Cayo District's number of constituencies to six (from four) had the most impact. Later the following year (2005) the law was passed to create two additional constituencies within the boundaries of Cayo. The newly created constituencies are Belmopan, containing the capital city of that name, and Cayo North East, centered on Spanish Lookout.
These new constituencies held their first-ever election during the General Election in 2008.
List of Belize's constituencies by district
Below are the Districts and their respective constituencies:
- Belize District
- Cayo District
- Corozal District
- Corozal Bay
- Corozal North
- Corozal South East
- Corozal South West
- Orange Walk District
- Orange Walk Central
- Orange Walk East
- Orange Walk North
- Orange Walk South
- Stann Creek District
- Dangriga
- Stann Creek West
- Toledo District
- Toledo East
- Toledo West
Voting population by constituency
Below is a list of the voting population by constituency as of March 2015, sorted out by districts for ease of reference.
Note that these populations are for Belizean citizens who are eligible to vote and does not represent actual population. As of March 2015 the voting population of Belize is estimated at 148,026 while the total population is estimated at 301,300.
The Voter Age Population (VAP), i.e. all persons over the age of eighteen, is 161,677, or 53.66% of the total population. Of these, more than 91 percent are actually registered. Males slightly outnumber females in the population, though the gap is noticeable in the larger urban areas such as Belize City, home to 10 constituencies.
| District | Constituency | Total | Nationwide Rank | District Rank |
|---|---|---|---|---|
| Belize | Albert | 3072 | 30th | 12th |
| Belize Rural Central | 4511 | 21st | 4th | |
| Belize Rural North | 4578 | 20th | 3rd | |
| Belize Rural South | 5159 | 13th | 1st | |
| Caribbean Shores | 4291 | 23rd | 5th | |
| Collet | 3637 | 26th | 8th | |
| Fort George | 3047 | 31st | 13th | |
| Freetown | 3452 | 27th | 9th | |
| Lake Independence | 4925 | 18th | 2nd | |
| Mesopotamia | 3170 | 28th | 10th | |
| Pickstock | 3166 | 29th | 11th | |
| Port Loyola | 3890 | 24th | 6th | |
| Queen's Square | 3862 | 25th | 7th | |
| Cayo | Belmopan | 5667 | 5th | 2nd |
| Cayo Central | 5923 | 3rd | 1st | |
| Cayo North | 5015 | 17th | 5th | |
| Cayo North East | 4413 | 22nd | 6th | |
| Cayo South | 5468 | 8th | 4th | |
| Cayo West | 5378 | 10th | 3rd | |
| Corozal | Corozal Bay | 5100 | 16th | 3rd |
| Corozal North | 5108 | 15th | 2nd | |
| Corozal South East | 5190 | 12th | 1st | |
| Corozal South West | 4869 | 19th | 4th | |
| Orange Walk | Orange Walk Central | 5727 | 4th | 2nd |
| Orange Walk East | 5443 | 9th | 4th | |
| Orange Walk North | 6011 | 2nd | 1st | |
| Orange Walk South | 5575 | 6th | 3rd | |
| Stann Creek | Dangriga | 5114 | 14th | 2nd |
| Stann Creek West | 6470 | 1st | 1st | |
| Toledo | Toledo East | 5473 | 7th | 1st |
| Toledo West | 5324 | 11th | 2nd | |
| National | 31 | 148,026 | Avg. Voters per constituency | 4775 |
Current Area Representatives
History
Below is the chronological order for the creation of Belize's current constituencies.
- 1954
- The following were the nine original constituencies created for the British Honduras Legislative Assembly:
- Belize District: Belize North, Belize Rural, Belize South, Belize West
- Cayo District: Cayo
- Corozal District: Corozal
- Orange Walk District: Orange Walk
- Stann Creek District: Stann Creek
- Toledo District: Toledo
- The following were the nine original constituencies created for the British Honduras Legislative Assembly:
- 1961
- In a major nationwide redistricting, all of the previous constituencies were abolished and replaced with the following, doubling the total number of constituencies to 18:
- Belize District: Albert, Belize Rural North, Belize Rural South, Collet, Fort George, Freetown, Mesopotamia, Pickstock
- Cayo District: Cayo North, Cayo South
- Corozal District: Corozal North, Corozal South
- Orange Walk District: Orange Walk North, Orange Walk South
- Stann Creek District: Stann Creek Town, Stann Creek Rural
- Toledo District: Toledo North, Toledo South
- In a major nationwide redistricting, all of the previous constituencies were abolished and replaced with the following, doubling the total number of constituencies to 18:
- 1973
- British Honduras officially renamed Belize. The British Honduras Legislative Assembly becomes the Belize House of Representatives.
- 1979
- The following were renamed:
- Stann Creek District: Stann Creek Town renamed Dangriga, Stann Creek Rural renamed Stann Creek West.[2]
- The following were renamed:
- 1984
- The following constituencies were created:
- Belize District: Caribbean Shores, Lake Independence, Queen's Square, Port Loyola
- Cayo District: Cayo Central, Cayo West
- Corozal District: Corozal Bay
- Orange Walk District: Orange Walk Central, Orange Walk East
- The following were altered:
- Corozal District: Corozal South was split into Corozal South East and Corozal South West
- Toledo District: Toledo North and Toledo South were abolished, replaced by Toledo East and Toledo West
- The following constituencies were created:
- 1993
- The following constituency was created:
- Belize District: Belize Rural Central
- The following constituency was created:
- 2008
- The following constituencies were created:
- Cayo District: Belmopan, Cayo North East
- The following constituencies were created:
See also
References
- ↑ January 2008 Estimate
- ↑ General Elections 1979, Belize Elections and Boundaries Commission. (accessed 19 November 2014)
- Belize Elections & Boundaries Department's Map of Belize's Constituencies
- Government of Belize's Official Website
- Boundary Re-districting