Demographics of Mauritius
This article is about the demographic features of the population of Mauritius, including population density, ethnicity, education level, health of the populace, economic status, religious affiliations and other aspects of the population.
Mauritian society includes people from many different ethnic groups. A majority of the republic's residents are the descendants of people from the Indian subcontinent. Mauritius also contains substantial populations from continental Africa, China, France, Great Britain, Madagascar and South Africa among other places.
Ethnic groups
The majority of the population are Indo-Mauritians (people of Indian descent) who make up 68% of the population.[1] Creoles (of African descent or mixed-race) are about a quarter of the population.[1] There are approximately 30,000 Sino-Mauritians from the Hakka and other Chinese sub-ethnic/linguistic groups.[2]
Franco-Mauritians (Mauritian of French ancestry) are numbered about 24,000. The Franco-Mauritian group, mostly are the descendants of former slave-owners, comprises the largest group of people of European origin on the island.[3] There is a smaller population of people of British descent living in Mauritius, most of whom have Mauritian nationality. The term Anglo-Mauritian, which may also include Mauritians living in the UK, is used unofficially.
Small groups of foreign students from Europe or the Indian Ocean region are also present. Recent years have seen a steady flow of foreign workers into the textile industry (primarily Chinese women), the construction industry (primarily Indian workers), and harbour-related activities (primarily Taiwanese men). Immigration policy does not provoke much debate in Mauritius, and the relative economic stability of the island serves to attract foreign workers.
Population
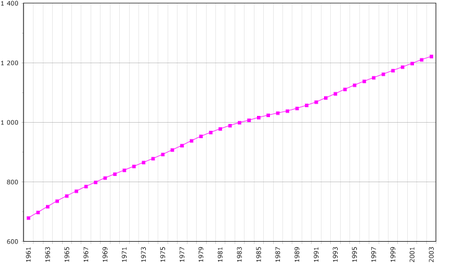
According to the 2010 revision of the World Population Prospects the total population was 1,281,000 in 2010, compared to 479,000 in 1950.[4]
The proportion of the population aged under 15 was 21.9% in 2010.[4] 71.2% were between 15 and 65 years of age, with 6.9% being 65 years or older .[4]
| Total population (x 1000) | Population aged 0–14 (%) | Population aged 15–64 (%) | Population aged 65+ (%) | |
|---|---|---|---|---|
| 1950 | 479 | 45.2 | 51.9 | 3.0 |
| 1955 | 570 | 46.1 | 51.3 | 2.6 |
| 1960 | 662 | 46.6 | 50.9 | 2.5 |
| 1965 | 754 | 46.2 | 51.3 | 2.5 |
| 1970 | 828 | 43.8 | 53.6 | 2.6 |
| 1975 | 891 | 39.9 | 57.3 | 2.8 |
| 1980 | 966 | 35.4 | 61.0 | 3.6 |
| 1985 | 1 021 | 31.4 | 64.5 | 4.1 |
| 1990 | 1 059 | 29.7 | 65.8 | 4.5 |
| 1995 | 1 122 | 27.8 | 67.2 | 5.0 |
| 2000 | 1 187 | 26.7 | 67.6 | 5.7 |
| 2005 | 1 243 | 24.8 | 69.1 | 6.1 |
| 2010 | 1 281 | 21.9 | 71.2 | 6.9 |
Structure of the population [5]
Structure of the population (04.07.2011) (Census, complete tabulation) :
| Age Group | Male | Female | Total | % |
|---|---|---|---|---|
| Total | 610 848 | 625 969 | 1 236 817 | 100 |
| 0-4 | 36 702 | 36 376 | 73 078 | 5,91 |
| 5-9 | 44 947 | 44 068 | 89 015 | 7,20 |
| 10-14 | 47 302 | 46 337 | 93 639 | 7,57 |
| 15-19 | 50 715 | 50 293 | 101 008 | 8,17 |
| 20-24 | 46 871 | 45 800 | 92 671 | 7,49 |
| 25-29 | 45 589 | 45 348 | 90 937 | 7,35 |
| 30-34 | 52 182 | 51 247 | 103 429 | 8,36 |
| 35-39 | 44 241 | 43 556 | 87 797 | 7,10 |
| 40-44 | 45 150 | 44 236 | 89 386 | 7,23 |
| 45-49 | 49 800 | 49 541 | 99 341 | 8,03 |
| 50-54 | 42 996 | 43 341 | 86 337 | 6,98 |
| 55-59 | 35 713 | 37 341 | 73 054 | 5,91 |
| 60-64 | 27 143 | 30 199 | 57 342 | 4,64 |
| 65-69 | 15 846 | 19 593 | 35 439 | 2,87 |
| 70-74 | 10 986 | 14 389 | 25 375 | 2,05 |
| 75-79 | 7 349 | 10 695 | 18 044 | 1,46 |
| 80-84 | 4 176 | 7 193 | 11 369 | 0,92 |
| 85-89 | 2 135 | 4 233 | 6 368 | 0,51 |
| 90-94 | 512 | 1 470 | 1 982 | 0,16 |
| 95-99 | 107 | 384 | 491 | 0,04 |
| 100+ | 13 | 83 | 96 | 0,01 |
| unknown | 373 | 246 | 619 | 0,05 |
| Age group | Male | Female | Total | Percent |
|---|---|---|---|---|
| 0-14 | 128 951 | 126 781 | 255 732 | 20,68 |
| 15-64 | 440 400 | 440 902 | 881 302 | 71,26 |
| 65+ | 41 124 | 58 040 | 99 164 | 8,02 |
Structure of the population (01.07.2012) (Estimates based on the results of the 2011 Population Census) :
| Age Group | Male | Female | Total | % |
|---|---|---|---|---|
| Total | 621 297 | 634 585 | 1 255 882 | 100 |
| 0-4 | 38 379 | 37 772 | 76 151 | 6,06 |
| 5-9 | 46 802 | 45 130 | 91 932 | 7,32 |
| 10-14 | 49 926 | 48 044 | 97 970 | 7,80 |
| 15-19 | 50 158 | 49 996 | 100 154 | 7,97 |
| 20-24 | 48 747 | 47 374 | 96 121 | 7,65 |
| 25-29 | 43 794 | 43 392 | 87 186 | 6,94 |
| 30-34 | 52 325 | 51 550 | 103 875 | 8,27 |
| 35-39 | 45 447 | 44 448 | 89 895 | 7,16 |
| 40-44 | 43 961 | 43 150 | 87 111 | 6,94 |
| 45-49 | 49 134 | 48 570 | 97 704 | 7,78 |
| 50-54 | 43 718 | 44 514 | 88 232 | 7,03 |
| 55-59 | 37 174 | 38 625 | 75 799 | 6,04 |
| 60-64 | 28 929 | 31 946 | 60 875 | 4,85 |
| 65-69 | 16 986 | 20 842 | 37 828 | 3,01 |
| 70-74 | 11 099 | 14 471 | 25 570 | 2,04 |
| 75-79 | 7 761 | 11 311 | 19 072 | 1,52 |
| 80-84 | 4 077 | 7 033 | 11 110 | 0,88 |
| 85+ | 2 880 | 6 417 | 9 297 | 0,74 |
| Age group | Male | Female | Total | Percent |
|---|---|---|---|---|
| 0-14 | 135 107 | 130 946 | 266 053 | 21,18 |
| 15-64 | 443 387 | 443 565 | 886 952 | 70,62 |
| 65+ | 42 803 | 60 074 | 102 877 | 8,19 |
Vital statistics

Mauritius has an estimated population of 1,283,415 on December 31, 2010. 14,701 children were born in 2011 (birth rate 11.4 per 1,000).[6]
The table below presents the population development of Mauritius since 1900. The figure up to 1945 are for the island of Mauritius only. As of 1946 the island of Rodrigues is included.
Figures from Statistics Mauritius[7] and United Nations Demographic Yearbook.[8]
| Average population (x 1000) | Live births | Deaths | Natural change | Crude birth rate (per 1000) | Crude death rate (per 1000) | Natural change (per 1000) | TFR | |
|---|---|---|---|---|---|---|---|---|
| 1900 | 371 | 14 490 | 13 695 | 795 | 38.6 | 36.5 | 2.1 | |
| 1901 | 371 | 12 910 | 14 970 | -2 060 | 34.8 | 40.4 | -5.6 | |
| 1902 | 371 | 13 495 | 12 716 | 779 | 35.9 | 33.8 | 2.1 | |
| 1903 | 371 | 13 611 | 15 034 | -1 423 | 36.3 | 40.1 | -3.8 | |
| 1904 | 371 | 14 103 | 12 064 | 2 039 | 37.2 | 31.9 | 5.3 | |
| 1905 | 370 | 14 043 | 15 379 | -1 336 | 37.2 | 40.7 | -3.5 | |
| 1906 | 370 | 12 669 | 15 124 | -2 455 | 33.6 | 40.0 | -6.4 | |
| 1907 | 370 | 14 186 | 13 037 | 1 149 | 37.7 | 34.6 | 3.1 | |
| 1908 | 370 | 13 456 | 15 094 | -1 638 | 36.0 | 40.3 | -4.3 | |
| 1909 | 369 | 12 837 | 13 761 | - 924 | 34.4 | 36.9 | -2.5 | |
| 1910 | 369 | 13 329 | 12 488 | 841 | 36.1 | 33.8 | 2.3 | |
| 1911 | 369 | 14 585 | 12 204 | 2 381 | 39.2 | 32.8 | 6.4 | |
| 1912 | 370 | 13 209 | 14 429 | -1 220 | 35.5 | 38.8 | -3.3 | |
| 1913 | 371 | 15 153 | 13 201 | 1 952 | 40.8 | 35.5 | 5.3 | |
| 1914 | 372 | 15 229 | 12 134 | 3 095 | 40.8 | 32.5 | 8.3 | |
| 1915 | 373 | 13 094 | 13 101 | - 7 | 34.8 | 34.8 | -0.0 | |
| 1916 | 374 | 13 162 | 11 432 | 1 730 | 35.0 | 30.4 | 4.6 | |
| 1917 | 375 | 13 887 | 12 234 | 1 653 | 36.9 | 32.5 | 4.4 | |
| 1918 | 375 | 13 109 | 12 794 | 315 | 34.8 | 33.9 | 0.9 | |
| 1919 | 375 | 13 261 | 24 455 | -11 194 | 35.2 | 64.9 | -29.7 | |
| 1920 | 376 | 12 791 | 11 773 | 1 018 | 35.1 | 32.3 | 2.8 | |
| 1921 | 376 | 14 360 | 15 159 | - 799 | 38.1 | 40.3 | -2.2 | |
| 1922 | 376 | 13 955 | 12 967 | 988 | 37.0 | 34.5 | 2.5 | |
| 1923 | 377 | 13 879 | 10 778 | 3 101 | 36.8 | 28.5 | 8.3 | |
| 1924 | 380 | 15 430 | 10 558 | 4 872 | 41.1 | 28.1 | 13.0 | |
| 1925 | 383 | 16 545 | 9 327 | 7 218 | 42.6 | 24.9 | 17.7 | |
| 1926 | 386 | 15 520 | 9 958 | 5 562 | 39.4 | 25.3 | 14.1 | |
| 1927 | 389 | 13 748 | 10 015 | 3 733 | 34.5 | 25.1 | 9.4 | |
| 1928 | 391 | 15 206 | 11 342 | 3 864 | 37.9 | 28.2 | 9.7 | |
| 1929 | 393 | 13 771 | 12 413 | 1 358 | 34.0 | 30.7 | 3.3 | |
| 1930 | 393 | 12 793 | 14 341 | -1 548 | 31.6 | 35.4 | -3.8 | |
| 1931 | 393 | 11 941 | 15 467 | -3 526 | 29.7 | 38.4 | -8.7 | |
| 1932 | 390 | 10 266 | 12 848 | -2 582 | 25.7 | 32.2 | -6.5 | |
| 1933 | 390 | 13 479 | 10 615 | 2 864 | 33.8 | 26.6 | 7.2 | |
| 1934 | 392 | 13 516 | 10 069 | 3 447 | 33.7 | 25.1 | 8.6 | |
| 1935 | 394 | 13 246 | 10 445 | 2 801 | 32.8 | 25.8 | 7.0 | |
| 1936 | 398 | 13 867 | 10 500 | 3 367 | 34.1 | 25.8 | 8.3 | |
| 1937 | 400 | 14 097 | 11 527 | 2 570 | 34.4 | 28.1 | 6.3 | |
| 1938 | 402 | 13 420 | 12 046 | 1 374 | 32.6 | 29.2 | 3.4 | |
| 1939 | 405 | 14 578 | 11 340 | 3 238 | 35.2 | 27.4 | 7.8 | |
| 1940 | 407 | 12 145 | 10 373 | 1 772 | 29.1 | 24.9 | 4.2 | |
| 1941 | 407 | 13 430 | 10 436 | 2 994 | 32.2 | 25.0 | 7.2 | |
| 1942 | 408 | 13 553 | 11 927 | 1 626 | 32.5 | 28.6 | 3.9 | |
| 1943 | 410 | 13 604 | 10 642 | 2 962 | 32.6 | 25.5 | 7.1 | |
| 1944 | 419 | 18 258 | 11 355 | 6 903 | 43.4 | 27.0 | 16.4 | |
| 1945 | 424 | 16 290 | 15 277 | 1 013 | 38.4 | 36.0 | 2.4 | |
| 1946 | 437 | 16 939 | 12 678 | 4 261 | 38.8 | 29.0 | 9.8 | |
| 1947 | 445 | 19 458 | 8 830 | 10 628 | 43.7 | 19.8 | 23.9 | |
| 1948 | 455 | 19 429 | 10 680 | 8 749 | 42.7 | 23.5 | 19.2 | |
| 1949 | 458 | 20 931 | 7 523 | 13 408 | 45.7 | 16.4 | 29.3 | |
| 1950 | 479 | 23 667 | 6 611 | 17 056 | 49.4 | 13.8 | 35.6 | |
| 1951 | 498 | 23 543 | 7 305 | 16 238 | 47.3 | 14.7 | 32.6 | |
| 1952 | 514 | 24 689 | 7 569 | 17 120 | 48.0 | 14.7 | 33.3 | |
| 1953 | 537 | 24 428 | 8 550 | 15 878 | 45.5 | 15.9 | 29.6 | |
| 1954 | 551 | 22 513 | 8 587 | 13 926 | 40.9 | 15.6 | 25.3 | |
| 1955 | 570 | 23 612 | 7 260 | 16 352 | 41.4 | 12.7 | 28.7 | |
| 1956 | 591 | 25 666 | 6 910 | 18 756 | 43.4 | 11.7 | 31.7 | |
| 1957 | 609 | 26 055 | 7 823 | 18 232 | 42.8 | 12.8 | 29.9 | |
| 1958 | 627 | 25 398 | 7 307 | 18 091 | 40.5 | 11.7 | 28.9 | |
| 1959 | 644 | 24 792 | 7 040 | 17 752 | 38.5 | 10.9 | 27.6 | |
| 1960 | 662 | 26 017 | 7 588 | 18 429 | 39.3 | 11.5 | 27.8 | |
| 1961 | 680 | 27 028 | 6 697 | 20 331 | 39.7 | 9.8 | 29.9 | |
| 1962 | 700 | 27 162 | 6 485 | 20 677 | 38.8 | 9.3 | 29.5 | |
| 1963 | 715 | 28 859 | 6 912 | 21 947 | 40.4 | 9.7 | 30.7 | |
| 1964 | 735 | 28 610 | 6 421 | 22 189 | 38.9 | 8.7 | 30.2 | |
| 1965 | 754 | 27 195 | 6 637 | 20 558 | 36.1 | 8.8 | 27.3 | |
| 1966 | 773 | 27 831 | 6 944 | 20 887 | 36.0 | 9.0 | 27.0 | |
| 1967 | 789 | 24 471 | 6 750 | 17 721 | 31.0 | 8.6 | 22.5 | |
| 1968 | 804 | 25 409 | 7 382 | 18 027 | 31.6 | 9.2 | 22.4 | |
| 1969 | 815 | 22 621 | 6 733 | 15 888 | 27.7 | 8.3 | 19.5 | |
| 1970 | 828 | 22 765 | 6 520 | 16 245 | 27.5 | 7.9 | 19.6 | |
| 1971 | 841 | 21 926 | 6 436 | 15 490 | 26.1 | 7.7 | 18.4 | |
| 1972 | 851 | 21 495 | 6 753 | 14 742 | 25.3 | 7.9 | 17.3 | |
| 1973 | 869 | 20 015 | 6 779 | 13 236 | 23.0 | 7.8 | 15.2 | |
| 1974 | 881 | 24 002 | 6 424 | 17 578 | 27.3 | 7.3 | 20.0 | |
| 1975 | 891 | 22 557 | 7 201 | 15 356 | 25.3 | 8.1 | 17.2 | |
| 1976 | 903 | 23 274 | 6 968 | 16 306 | 25.8 | 7.7 | 18.0 | |
| 1977 | 918 | 23 859 | 7 154 | 16 705 | 26.0 | 7.8 | 18.2 | |
| 1978 | 934 | 25 278 | 6 596 | 18 682 | 27.1 | 7.1 | 20.0 | |
| 1979 | 948 | 26 163 | 6 871 | 19 292 | 27.6 | 7.2 | 20.3 | |
| 1980 | 966 | 26 294 | 6 919 | 19 375 | 27.2 | 7.2 | 20.1 | |
| 1981 | 981 | 24 967 | 6 653 | 18 314 | 25.5 | 6.8 | 18.7 | |
| 1982 | 993 | 22 459 | 6 584 | 15 875 | 22.6 | 6.6 | 16.0 | |
| 1983 | 1 002 | 21 073 | 6 532 | 14 541 | 21.0 | 6.5 | 14.5 | |
| 1984 | 1 011 | 20 332 | 6 646 | 13 686 | 20.1 | 6.6 | 13.5 | |
| 1985 | 1 021 | 19 376 | 6 906 | 12 470 | 19.0 | 6.8 | 12.2 | |
| 1986 | 1 028 | 19 170 | 6 805 | 12 365 | 18.6 | 6.6 | 12.0 | |
| 1987 | 1 037 | 20 033 | 6 753 | 13 280 | 19.3 | 6.5 | 12.8 | |
| 1988 | 1 043 | 20 941 | 6 879 | 14 062 | 20.1 | 6.6 | 13.5 | |
| 1989 | 1 051 | 21 822 | 7 149 | 14 673 | 20.8 | 6.8 | 14.0 | |
| 1990 | 1 059 | 22 602 | 7 031 | 15 571 | 21.3 | 6.6 | 14.7 | |
| 1991 | 1 070 | 22 197 | 7 027 | 15 170 | 20.7 | 6.6 | 14.2 | |
| 1992 | 1 084 | 22 902 | 7 023 | 15 879 | 21.1 | 6.5 | 14.6 | |
| 1993 | 1 098 | 22 329 | 7 433 | 14 896 | 20.3 | 6.8 | 13.6 | |
| 1994 | 1 113 | 21 795 | 7 402 | 14 393 | 19.6 | 6.7 | 12.9 | |
| 1995 | 1 122 | 20 549 | 7 465 | 13 084 | 18.3 | 6.7 | 11.7 | |
| 1996 | 1 134 | 20 763 | 7 670 | 13 093 | 18.3 | 6.8 | 11.5 | |
| 1997 | 1 148 | 20 012 | 7 986 | 12 026 | 17.4 | 7.0 | 10.5 | |
| 1998 | 1 160 | 19 434 | 7 839 | 11 595 | 16.8 | 6.8 | 10.0 | |
| 1999 | 1 175 | 20 311 | 7 944 | 12 367 | 17.3 | 6.8 | 10.5 | |
| 2000 | 1 187 | 20 205 | 7 982 | 12 223 | 17.0 | 6.7 | 10.3 | |
| 2001 | 1 200 | 19 696 | 7 983 | 11 713 | 16.4 | 6.7 | 9.8 | |
| 2002 | 1 210 | 19 983 | 8 310 | 11 673 | 16.5 | 6.9 | 9.6 | |
| 2003 | 1 223 | 19 343 | 8 520 | 10 823 | 15.8 | 7.0 | 8.8 | |
| 2004 | 1 233 | 19 230 | 8 475 | 10 755 | 15.6 | 6.9 | 8.7 | |
| 2005 | 1 243 | 18 820 | 8 646 | 10 174 | 15.1 | 7.0 | 8.2 | |
| 2006 | 1 253 | 17 604 | 9 162 | 8 442 | 14.0 | 7.3 | 6.7 | |
| 2007 | 1 261 | 17 034 | 8 498 | 8 536 | 13.5 | 6.7 | 6.8 | |
| 2008 | 1 268 | 16 372 | 9 004 | 7 368 | 12.9 | 7.1 | 5.8 | |
| 2009 | 1 275 | 15 344 | 9 224 | 6 120 | 12.0 | 7.2 | 4.8 | 1.502 |
| 2010 | 1 281 | 15 005 | 9 131 | 5 874 | 11.7 | 7.1 | 4.6 | 1.466 |
| 2011 | 1 286 | 14 701 | 9 170 | 5 531 | 11.7 | 7.3 | 4.4 | 1.446 |
| 2012 | 14 502 | 9 343 | 5 159 | 11.5 | 7.4 | 4.1 | 1.544 | |
| 2013 | 13 688 | 9 440 | 4 248 | 10.9 | 7.5 | 3.4 | 1.438 | |
| 2014 | 13 283 | 9 682 | 3 601 | 10.5 | 7.7 | 2.8 | 1.424 | |
| 2015 | 1,263 | 12,738 | 9,747 | 2,991 | 10.1 | 7.7 | 2.4 | |
Language
The main languages spoken in Mauritius are English, French and Mauritian Creole. There is no official language. English is the official language of the parliament, though French is also permitted. However, the lingua franca is Mauritian Creole and the newspapers and television programms are usually in French.[9]
Mauritian Créole, which is spoken by 90 percent of the population, is considered to be the native language of the country and is used most often in informal settings.[10] It was developed in the 18th century by slaves who used a pidgin language to communicate with each other as well as with their French masters, who did not understand the various African languages. The pidgin evolved with later generations to become a casual language.[11]
Mauritian Creole is a French-based creole due to its close ties with French pronunciation and vocabulary. Bhojpuri is also spoken by a large percentage of Mauritian people at home and in informal scenarios.[12]
Religion
The religions present in the republic are Hinduism 51.9%, Roman Catholicism 25.1%, Other Christian 5.3%, Islam 15.3%, None 0.7%, Other 0.6, Unspecified 0.1%[13]
More than 90% of the Sino-Mauritian community are Christian; the remainder are largely Buddhist.[2]
CIA World Factbook demographic statistics
The following demographic statistics are from the CIA World Factbook, unless otherwise indicated.
Population growth rate: 0.776% (2010 est.)
Sex ratio:
at birth
1 male(s)/female
under 15 years:
1.03 male(s)/female
15–64 years:
0.99 male(s)/female
65 years and over:
0.67 male(s)/female
total population:
0.98 male(s)/female (2000 est.)
Infant mortality rate: 17.73 deaths/1,000 live births (2000 est.) - 12.2 deaths/1,000 live births (2010 est.)
Life expectancy at birth:
total population:
74 years
male:
70.53 years
female:
77.65 years (2010 est.)
Total fertility rate: 2.02 children born/woman (2000 est.) 1.80 children born/woman (2010 est.)
Nationality:
noun:
Mauritian(s)
adjective:
Mauritian
Ethnic groups: [13]
Indian 68% Creole 27% Chinese 3% French 2%
Religions:[13]
Hinduism 48.5% Roman Catholicism 26.3% Other Christian 6.4% Islam 17.3% None 0.7% Other 0.6 Unspecified 0.1%
Languages:[13]
Creole 86.5% Bhojpuri 5.3% French 4.1%, Two languages 1.4%, Other 2.6% (includes English, which is spoken by less than 1% of the population) Unspecified 0.1% (2011 est.)
Literacy:
definition:
age 15 and over can read and write
total population:
84.4%
male:
88.4%
female:
80.5% (2000 est.)
References
| Wikimedia Commons has media related to Demographics of Mauritius. |
- 1 2 https://www.cia.gov/library/publications/the-world-factbook/geos/mp.html#People
- 1 2 Eriksen 1998, p. 82
- ↑ Eriksen 2004, p. 80
- 1 2 3 Population Division of the Department of Economic and Social Affairs of the United Nations Secretariat, World Population Prospects: The 2010 Revision
- ↑ http://unstats.un.org/unsd/demographic/products/dyb/dyb2.htm
- ↑
- ↑
- ↑ "United Nations Statistics Division - Demographic and Social Statistics". unstats.un.org.
- ↑ "Coexistence International at Brandeis University" (PDF). Retrieved 2010-07-04.
- ↑ English Usage in Mauritius
- ↑ Facts and Figures
- ↑ Holm, J. (1989). Pidgins and Creoles. New York: Cambridge University Press. p. 476., p.353.
- 1 2 3 4 "Africa :: MAURITIUS". CIA The World Factbook.
- Eriksen, Thomas Hylland (1998), Common Denominators: Nation-building and Compromise in Mauritius, Berg Publishers, ISBN 978-1-85973-959-4
- Mauritius Soleiro Car Rental
Mauritius articles | ||||||||||||||||||||||
|---|---|---|---|---|---|---|---|---|---|---|---|---|---|---|---|---|---|---|---|---|---|---|
| Subdivisions |
| .svg.png) | ||||||||||||||||||||
| Politics | ||||||||||||||||||||||
| Economy | ||||||||||||||||||||||
| Society |
| |||||||||||||||||||||
| ||||||||||||||||||||||